
Page 49 - Industrial Process Plant Construction Estimating and Man Hour Analysis
P. 49
Introduction to construction statistics using Excel Chapter 1 19
1.7 The mean, variance and standard deviation measures of
central tendency statistical formulas for the mean, variance and
standard deviation
Mean: The arithmetic mean of a set of data is denoted by Y; it is simply the
arithmetic average of all the observations; the formula for the mean is
Y ¼ Y1þY2þ⋯þYnÞ=n
ð
y can be written
n
X
y ¼ yi=n
i¼1
Excel function:
Excel function: The mean is calculated in Excel using the function
AVERAGE.
AVERAGE (number 1, number 2): Returns the average (arithmetic mean)
of its arguments, which can be numbers or names, arrays, or references that
contain numbers.
Using Excel statistical functions set up Table 1.7.1
To use the Excel statistical functions, go to quick access toolbar; select
More Functions, and then, select Statistical.
Excel statistical functions are used to calculate values for data. Set up Tem-
plate 1.7.1
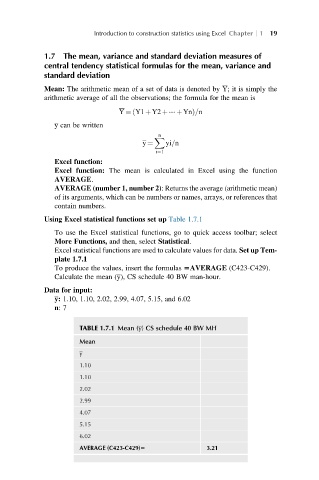
To produce the values, insert the formulas 5AVERAGE (C423-C429).
Calculate the mean (y), CS schedule 40 BW man-hour.
Data for input:
y: 1.10, 1.10, 2.02, 2.99, 4.07, 5.15, and 6.02
n:7
TABLE 1.7.1 Mean (y) CS schedule 40 BW MH
Mean
y
1.10
1.10
2.02
2.99
4.07
5.15
6.02
AVERAGE (C423-C429)5 3.21