
Page 48 - Industrial Process Plant Construction Estimating and Man Hour Analysis
P. 48
18 Industrial process plant construction estimating and man-hour analysis
28,000
26,000
Y 24,000
22,000
20,000
1 2 3 4 5 6 7 8
Series1 Series2
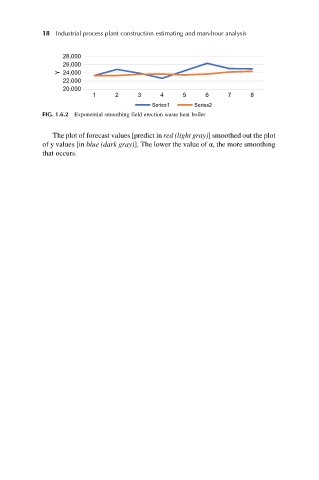
FIG. 1.6.2 Exponential smoothing field erection waste heat boiler.
The plot of forecast values [predict in red (light gray)] smoothed out the plot
of y values [in blue (dark gray)]. The lower the value of α, the more smoothing
that occurs.