
Page 47 - Industrial Process Plant Construction Estimating and Man Hour Analysis
P. 47
Introduction to construction statistics using Excel Chapter 1 17
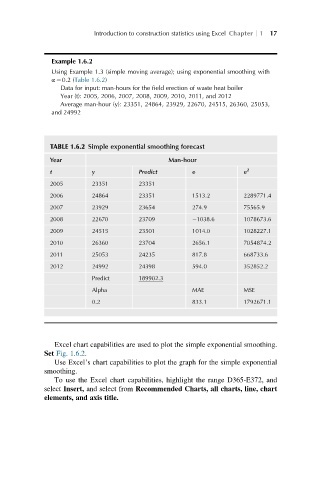
Example 1.6.2
Using Example 1.3 (simple moving average); using exponential smoothing with
α ¼0.2 (Table 1.6.2)
Data for input: man-hours for the field erection of waste heat boiler
Year (t): 2005, 2006, 2007, 2008, 2009, 2010, 2011, and 2012
Average man-hour (y): 23351, 24864, 23929, 22670, 24515, 26360, 25053,
and 24992
TABLE 1.6.2 Simple exponential smoothing forecast
Year Man-hour
t y Predict e e 2
2005 23351 23351
2006 24864 23351 1513.2 2289771.4
2007 23929 23654 274.9 75565.9
2008 22670 23709 1038.6 1078673.6
2009 24515 23501 1014.0 1028227.1
2010 26360 23704 2656.1 7054874.2
2011 25053 24235 817.8 668733.6
2012 24992 24398 594.0 352852.2
Predict 189902.3
Alpha MAE MSE
0.2 833.1 1792671.1
Excel chart capabilities are used to plot the simple exponential smoothing.
Set Fig. 1.6.2.
Use Excel’s chart capabilities to plot the graph for the simple exponential
smoothing.
To use the Excel chart capabilities, highlight the range D365-E372, and
select Insert, and select from Recommended Charts, all charts, line, chart
elements, and axis title.