
Page 224 - Inorganic Mass Spectrometry - Fundamentals and Applications
P. 224
Secondary Ion ass Spectrometry 209
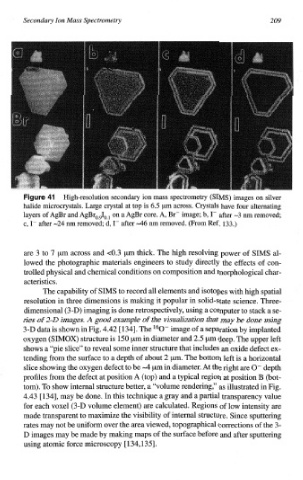
High-resolution secondary ion mass spectrometry (SMS) images on. silver
halide microcrystals. Large crystal at top is 6.5 prn across. Crystals have four alte~ating
layers of AgBr and Ag13ro~910~l on a AgBr core. A, Br” image; b, I” after -3 nm removed;
c, 1- after -24 nm removed; d, I- after -46 nm removed. (From Ref. 133.)
are 3 to 7 pm across and c0.3 pm thick. The high resolving power of SIMS al-
lowed the photographic materials engineers to study directly the effects of con-
trolled physical and chemical conditions on composition and mo~hological char-
acteristics.
The capability of SIMS to record all elements and isotopes with high spatial
resolution in three dimensions is making it popular in solid-state science. Three-
to
dimensional (3-D) imaging is done retrospectively, using a computer stack a se-
ries of 2-D images. A good example of the visualization that may be done using
3-D data is shown in Fig. 4.42 [134]. The l60- image of a separation by implanted
oxygen (SIMOX) structure is 150 pm in diameter and 2.5 pm deep. The upper left
shows a “pie slice’’ to reveal some inner structure that includes an oxide defect ex-
tending from the surface to a depth of about 2 pm. The bottom left is a ho~zontal
4 pm in diameter. At the right are 0” depth
slice showing the oxygen defect to be
profiles from the defect at position A (top) and a typical region at positio
tom). To show internal structure better, a “volume rendering,” as illustrate
4.43 [ 1341, may be done. In this technique a gray and a partial ~~sparency value
for each voxel(3-D volume element) are calculated. Regions of low inte~sity are
made an spa rent to maximize the visibility of internal structure. Since sputtering
rates may not be unifo~ over the area viewed, topo~aphical corrections of the 3-
D images may be made by making maps of the surface before and after sputtering
using atomic force microscopy [ 134,1351.