
Page 361 - Instant notes
P. 361
Magnetic resonance spectroscopy 347
The frequencies of resonance absorption for particular nuclei are quantified in terms of
their chemical shift from the frequency of a reference standard. The standard for proton
1
( H) NMR spectroscopy is tetramethylsilane (TMS), Si(CH 3) 4, which has a single
resonance absorption because the molecular symmetry ensures all protons are in
equivalent chemical environments. Chemical shifts are reported as a δ value relative to
the resonance frequency of the standard, :
in order that they are independent of the applied field. Values of δ are usually of the order
−6
10 and are conventionally expressed as parts per million (ppm). Typical chemical shifts
of protons in particular chemical environments are given in Table 2. Nuclei with values
δ>0 are referred to as deshielded, i.e. the local magnetic field experienced by these nuclei
is stronger than that experienced by the nuclei in the standard under the same conditions.
Nearby electron-withdrawing substituents cause increased deshielding.
The NMR spectrum of ethanol (CH 3CH 2OH) is shown in Fig. 2. The three distinct
chemical shifts indicate protons in three different types of environment. Since the
intensity of an NMR signal is proportional to the number of equivalent nuclei giving the
resonance, the integrated intensities of the three groups of lines are in the ratio 3:2:1 for
the three CH 3 protons, two CH 2 protons and one OH proton, respectively. This
quantitative property is a useful feature of NMR spectroscopy.
Fine structure
In addition to the effects of deshielding, the local magnetic field experienced by a
particular nucleus (or by equivalent nuclei) is also influenced by the presence of other
magnetic nuclei nearby and this creates fine structure in the corresponding resonance
frequency in the NMR spectrum. Fig. 2 shows the fine structure in the NMR spectrum of
ethanol. Fine structure splitting (spin-splitting) is not observed between nuclei in
equivalent chemical environments. The extent of
1
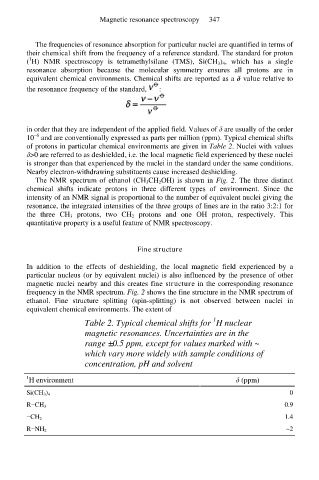
Table 2. Typical chemical shifts for H nuclear
magnetic resonances. Uncertainties are in the
range ±0.5 ppm, except for values marked with ~
which vary more widely with sample conditions of
concentration, pH and solvent
1 H environment δ (ppm)
Si(CH 3 ) 4 0
R−CH 3 0.9
−CH 2 1.4
R−NH 2 ~2