
Page 341 - Instrumentation Reference Book 3E
P. 341
324 Chemical analysis: spectroscopy
Table162 Prism frequency ranges
~~
Prism material Glass Quartz CaF2 LiF Nu Cl KBr (CsBr) Csl
._
Useful freauencv above above 5000-1300 5000-1700 5000-650 1100-285 1000-200
raiige (cm-') 3500 2860
Wavelength range (pm) below below 2.0-7.7 2.0-5.9 2-15.4 9-35 10-5
2.86 3.5
-
undergoes a pressure rise when heated by radiant gases simultaneously. Depending on require-
energy. One wall of the chamber functions as a ments, the components may include C02, NO,
mirror and reflects a light beam directed at it onto CO, SOz, HZ, NH3, hydrocarbons, and opacity
a photocell-the output of the photocell bearing or any other gases with selected spectral
a direct relation to the gas chamber expansion. absorption bands in the UV, visible, or IR. The
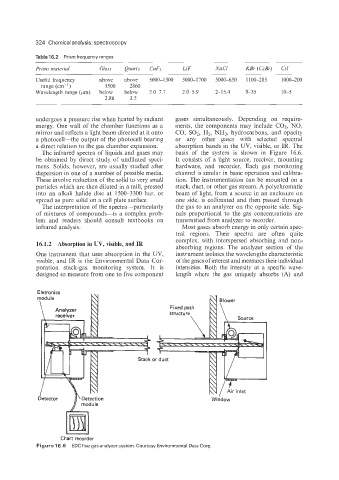
The infrared spectra of liquids and gases may basis of the system is shown in Figure 16.6.
be obtained by direct study of undiluted speci- It consists of a light source, receiver, mounting
mens. Solids, however, are usually studied after hardware, and recorder. Each gas monitoring
dispersion in one of a number of possible media. channel is similar in basic operation and calibra-
These involve reduction of the solid to very small tion. The instrumentation can be mounted on a
particles which are then diluted in a mill, pressed stack, duct, or other gas stream. A polychromatic
into an alkali halide disc at 1500-3300 bar, or beam of light, from a source in an enclosure on
spread as pure solid on a cell plate surface. one side, is collimated and then passed through
The interpretation of the spectra-particularly the gas to an analyzer on the opposite side. Sig-
of mixtures of compounds-is a complex prob- nals proportional to the gas concentrations are
lem and readers should consult textbooks on transmitted from analyzer to recorder.
infrared analysis. Most gases absorb energy in only certain spec-
tral regions. Their spectra are often quite
complex, with interspersed absorbing and non-
16.1.2 Absorption in UV, visible, and IR
absorbing regions. The analyzer section of the
One instrument that uses absorption in the UV, instrument isolates the wavelengths characteristic
visible, and IR is the Environmental Data Cor- of the gases of interest and measures their individual
poration stack-gas monitoring system. It is intensities. Both the intensity at a specific wave-
designed to measure from one to five component length where the gas uniquely absorbs (A) and
Eletronics
Fixed path N\
module
Blower
Chart recorder
Figure 16.6 EDCflue gas analyzer system. Courtesy Environmental Data Corp.