
Page 292 -
P. 292
274 CHAPTER 8 The Material Planning Process
or forecast future consumption. The company then procures materials based
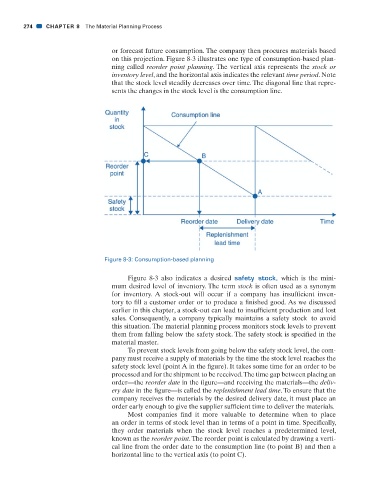
on this projection. Figure 8-3 illustrates one type of consumption-based plan-
ning called reorder point planning. The vertical axis represents the stock or
inventory level, and the horizontal axis indicates the relevant time period. Note
that the stock level steadily decreases over time. The diagonal line that repre-
sents the changes in the stock level is the consumption line.
Figure 8-3: Consumption-based planning
Figure 8-3 also indicates a desired safety stock, which is the mini-
mum desired level of inventory. The term stock is often used as a synonym
for inventory. A stock-out will occur if a company has insuffi cient inven-
tory to fi ll a customer order or to produce a fi nished good. As we discussed
earlier in this chapter, a stock-out can lead to insuffi cient production and lost
sales. Consequently, a company typically maintains a safety stock to avoid
this situation. The material planning process monitors stock levels to prevent
them from falling below the safety stock. The safety stock is specifi ed in the
material master.
To prevent stock levels from going below the safety stock level, the com-
pany must receive a supply of materials by the time the stock level reaches the
safety stock level (point A in the fi gure). It takes some time for an order to be
processed and for the shipment to be received. The time gap between placing an
order—the reorder date in the fi gure—and receiving the materials—the deliv-
ery date in the fi gure—is called the replenishment lead time. To ensure that the
company receives the materials by the desired delivery date, it must place an
order early enough to give the supplier suffi cient time to deliver the materials.
Most companies fi nd it more valuable to determine when to place
an order in terms of stock level than in terms of a point in time. Specifi cally,
they order materials when the stock level reaches a predetermined level,
known as the reorder point. The reorder point is calculated by drawing a verti-
cal line from the order date to the consumption line (to point B) and then a
horizontal line to the vertical axis (to point C).
31/01/11 6:42 AM
CH008.indd 274 31/01/11 6:42 AM
CH008.indd 274