
Page 189 - Integrated Wireless Propagation Models
P. 189
I
M a c r o c e I P r e d i c t i o n M o d e I s - P a r t 2 : P o i n t - t o - P o i n t M o d e I s 167
\
\
\
.,._ Negative slope
\
(a) Negative-slope condition
I /
h 1 , I /
l l I / / '
'
I / / / Positive slope
I /
V'
/
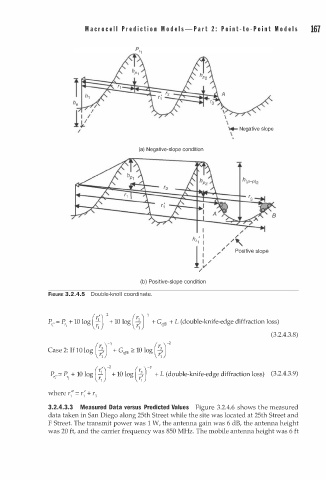
(b) Positive-slope condition
d
FIGURE 3.2.4.5 Double-knoll coor i nate.
P, · = P, + 10 log ( �) -2 + 10 log ( �) -y + Ge + L (double-knife-edge diffraction loss)
;
,
f!B
(3.2.4.3.8)
f!B � 10 log ( � r2
Case 2: If 10 log ( � ry + Ge
r3
P, ·= P, + 10 log (5.) -2 + 10 log ( ,) -r + L (double-knife-edge diffraction loss) (3.2.4.3.9)
;
� �
1
where r;' = r; + r3
3.2.4.3.3 Measured Data versus Predicted Values Figure 3.2.4.6 shows the measured
data taken in San Diego along 25th Street while the site was located at 25th Street and
F Street. The transmit power was 1 W, the antenna gain was 6 dB, the antenna height
was 20 ft, and the carrier frequency was 850 MHz. The mobile antenna height was 6 ft