
Page 190 - Integrated Wireless Propagation Models
P. 190
168 C h a p t e r T h r e e
Signal Strength Prediction
San Diego, Site I , 25th/Fst
I
Drive test along 25th St, 20 Ft antenna
o � � -r -r � :� � -r -r � ,- � � � � � -r � � ,- � � �
: : - , •••• Measured
- - - - - - - _ -i.- - - - - -r- - - ..,... Nonshadow prediction
:
-20 • _1 _ _ _ _ _ _ - - - - - >OOO< Shadow rediction
1
E
Ill ' ' ' '
- - - - -
J _ -40 - - - -: - - - - - - -- -:- \..- - - - - - - :-- - - - - - - - - -:- - - - - - - - -
- I + I + I I
.r:: t : � I ....... I : I :
......
:
OJ
c -60 - - - - - - - - - - -
- -
j
- � -
t - - - - - - - -
-
-
� i- - - - : - t---=-� - - - - t - - - - - - - -
u; : ...;r. - : . - "·t-:.. :
1 ' • • I • ... .... I
Cii -80 - - - - - - - :;{ � - - -:- - - - - - - "'-r .- -
c -
Ol ._ . ._ �: ! : - - .. . �
U5 � L : : . .. . � .
- - - - .... - - - - - -
-100 - - -· - - - - ..., _ - - - - - - - -· - - - - - - - - - ... - - - -
1 : : :
14 .., I I I
Shadow: : : :
-1 2 0 �� � � -· � � -L � -· � � -L � -· � � _. � �� � � �
·
-2000 -1000 0 1 000 2000 3000
Distance from antenna (feet)
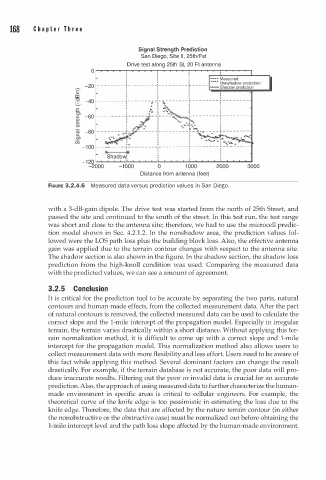
FtGURE 3.2.4.6 Measured data versus prediction val u es i n San Diego.
with a 3-dB-gain dipole. The drive test was started from the north of 25th Street, and
passed the site and continued to the south of the street. In this test run, the test range
was short and close to the antenna site; therefore, we had to use the microcell predic
tion model shown in Sec. 4.2. . 2. In the nonshadow area, the prediction values fol
1
lowed were the LOS path loss plus the building block loss. Also, the effective antenna
gain was applied due to the terrain contour changes with respect to the antenna site.
The shadow section is also shown in the figure. In the shadow section, the shadow loss
prediction from the high-knoll condition was used. Comparing the measured data
with the predicted values, we can see a amount of agreement.
3.2.5 Conclusion
It is critical for the prediction tool to be accurate by separating the two parts, natural
contours and human-made effects, from the collected measurement data. After the part
of natural contours is removed, the collected measured data can be used to calculate the
correct slope and the 1-mile intercept of the propagation model. Especially in irregular
terrain, the terrain varies drastically within a short distance. Without applying this ter
rain normalization method, it is difficult to come up with a correct slope and 1-mile
intercept for the propagation model. This normalization method also allows users to
collect measurement data with more flexibility and less effort. Users need to be aware of
this fact while applying this method. Several dominant factors can change the result
drastically. For example, if the terrain database is not accurate, the poor data will pro
duce inaccurate results. Filtering out the poor or invalid data is crucial for an accurate
prediction. Also, the approach of using measured data to further characterize the human
made environment in specific areas is critical to cellular engineers. For example, the
theoretical curve of the knife edge is too pessimistic in estimating the loss due to the
knife edge. Therefore, the data that are affected by the nature terrain contour (in either
the nonobstructive or the obstructive case) must be normalized out before obtaining the
1-mile intercept level and the path loss slope affected by the human-made environment.