Page 195 - Integrated Wireless Propagation Models
P. 195

30


                                  20 .
                               co
                               "0
                               c
                               c  1 0
                               ·ca
                               Ol
                               ell
                               c
                               c   0
                               2
                               c
                               ell
                               (1)
                               >   -10
                               n
                               (1)
                               'I=                   --- New algorithm
                               LU
                                 -20                 __  Original prediction
                                                         method
                                                     -- Best fit
                                 -30
                                    0     0.2    0.4    0.6    0.8
                                                    helh8
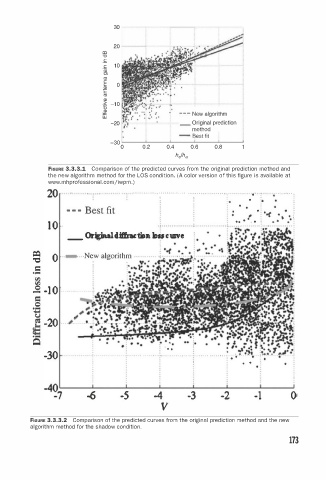
               FIGURE 3.3.3.1  Comparison of the predicted curves from the original prediction method and
                                                                              a
               the new  l gorithm method for the LOS condition. (A color version of this figure is av i lable at
                     a
               www.mhprofession l . c omjiwpm. )
                             a
               20                        . . ... . . . . . .  .  .  I  .  .  .  .  .  .  . . .. .. .  .     · ·  ·  ·  ·  ·  ·  ·  ·  ·  ·  ·  ·  ·  ·  ·  ·  •  •  • -; • · · · · · · ·  ·  ·  ·  ·     . .   •  .  . . .   ..-... .
                                                                                 .
                                                                   :
                                                                   : •   •
                                                                      •
                    -  -  -  Best fit                                       .       •
                                                                    :  • •  •  ,   ·.r
                                                                         •        ·  ,     .  :
                                                                                     •
                                                                           •    .   •
               1 0                                       ·.
                     _ Orjgin4iffractiDn lDu  n  n   e          •
                                                          •
                                                   •
                                                       •
                         . N  ew algorithm
           �  0
           =
          ·-
           fl.)
           fl.)
           0
           -  -1 0
           =              •
           0
          ·-
           1j
           =
              -20
          �
          ·-
           Q
                                                 .  .
              -30
                                                .  .  .  . .  .  .  .  . .    ·  ·  ·  -  ·  · ·  ·  · ·  ·    · · · · · · ·  ·     .  .
                                                         .
                                                                       •   •       •
                          -6        -5        -4       -3        -2        - 1       0
                                                v
          FIGURE 3.3.3.2  Comparison of the predicted curves from the original prediction method and the new
          algorithm method for the shadow condition.
                                                                                     173
   190   191   192   193   194   195   196   197   198   199   200