
Page 250 - Integrated Wireless Propagation Models
P. 250
228 C h a p t e r F o u r
0 Editable point
0 Fixed point
E'
co
2-
.c
0, ....
c .... ....
!!? ....
ti .... ....
� -- Macrocell overlay ....
� - - - Microcell-building loss .... ....
....
0.01 d, 0.1 d 1 r0 = 1.0
Distance (miles) (Log scale)
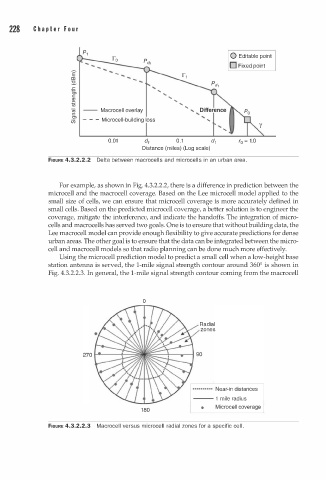
FIGURE 4.3.2.2.2 Delta between macrocells and microcells i n an urban area.
For example, as shown in Fig. 4.3.2.2.2, there is a difference in prediction between the
microcell and the macrocell coverage. Based on the Lee microcell model applied to the
small size of cells, we can ensure that microcell coverage is more accurately defined in
small cells. Based on the predicted microcell coverage, a better solution is to engineer the
coverage, mitigate the interference, and indicate the handoffs. The integration of micro
cells and macrocells has served two goals. One is to ensure that without building data, the
Lee macrocell model can provide enough flexibility to give accurate predictions for dense
urban areas. The other goal is to ensure that the data can be integrated between the micro
cell and macrocell models so that radio planning can be done much more effectively.
Using the microcell prediction model to predict a small cell when a low-height base
station antenna is served, the 1-mile signal strength contour around 360° is shown in
Fig. 4.3.2.2.3. In general, the 1-mile signal strength contour coming from the macrocell
0
Radial
zones
1 . ......... Near-in distances 1
--- 1 mile radius
I Microcell coverage I
1 8 0 •
FIGURE 4.3.2.2.3 Macrocel l versus microcel l radial zones for a specific cel l .