
Page 253 - Integrated Wireless Propagation Models
P. 253
M i c r o c e l l P r e d i c t i o n M o d e l s 231
-20.00 · - --
I'
-30.00
-40.00 �
E' � �
co -50.00 .. o Meas (dBm)
:s -60.00 ...... g ;oa _
•
if.) '"'� .... • l'".. o Pred (dBm)
(/) -70.00 '0 "'
a: . ," � �.·
-80.00
;'"'
-90.00
-100.00
0.00 0.20 0.40 0.60 0.80 1 . 00
Distance (mile)
(a)
1 0 0
/
80
/
� 60
u.. ;��"
8 40
/
20
J
00
0.00 5.00 1 0 .00 1 5 .00
Deviation (dB)
(b)
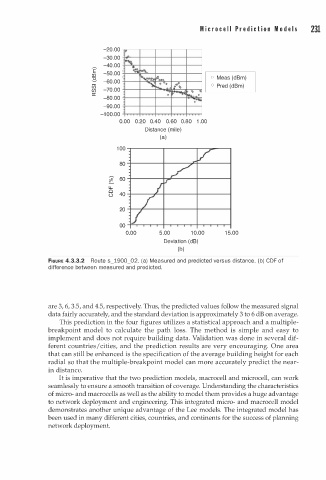
FIGURE 4.3.3.2 Route s_1900_02. (a) Measured and predicted versus distance. (b) CDF of
difference between measured and predicted.
are 3, 6, 3.5, and 4.5, respectively. Thus, the predicted values follow the measured signal
data fairly accurately, and the standard deviation is approximately 3 to 6 dB on average.
This prediction in the four figures utilizes a statistical approach and a multiple
breakpoint model to calculate the path loss. The method is simple and easy to
implement and does not require building data. Validation was done in several dif
ferent countries/ cities, and the prediction results are very encouraging. One area
that can still be enhanced is the specification of the average building height for each
radial so that the multiple-breakpoint model can more accurately predict the near
in distance.
It is imperative that the two prediction models, macrocell and microcell, can work
seamlessly to ensure a smooth transition of coverage. Understanding the characteristics
of micro- and macrocells as well as the ability to model them provides a huge advantage
to network deployment and engineering. This integrated micro- and macrocell model
demonstrates another unique advantage of the Lee models. The integrated model has
been used in many different cities, countries, and continents for the success of planning
network deployment.