
Page 255 - Integrated Wireless Propagation Models
P. 255
M i c r o c e l l P r e d i c t i o n M o d e l s 233
-10.00
-20.00
-30.00 L':.
E' -4o.oo ":\:
Ill 'I o Meas (dBm)
� -50.00 � ....
6'� !..,; eo .. o Pred (dBm)
U5 -60.00 • • 0
en r'4� : ��
a: -70.00 8
-·r �
-80.00
.
-90.00
0.00 0.20 0.40 0.60 0.80 1 . 00
Distance (mile)
Measured & predicted vs. distance
(a)
1 0 0
�
/
80
1/'
l 60
/
LL I
8 40 /
/
20
/
00
0.00 5.00 1 0 .00 1 5 .00
Deviation (dB)
CDF of difference between measured
and predicted
(b)
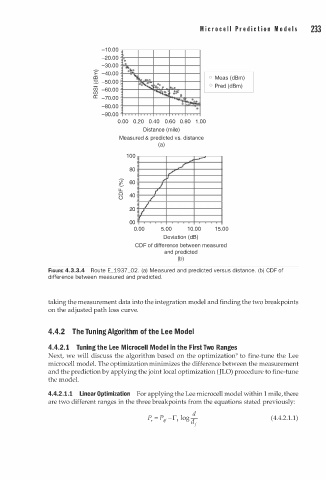
FIGURE 4.3.3.4 Route E_1937 _02 . (a) Measured and predicted versus distance. (b) CDF of
difference between measured and predicted.
taking the measurement data into the integration model and finding the two breakpoints
on the adjusted path loss curve.
4.4.2 The Tuning Algorithm of the Lee Model
4.4.2. 1 Tuning the Lee M i crocell Model in the First Two Ranges
Next, we will discuss the algorithm based on the optimization9 to fine-tune the Lee
microcell model. The optimization minimizes the difference between the measurement
and the prediction by applying the joint local optimization J LO) procedure to fine-tune
(
the model.
4.4. . 1 . 1 Linear Optimization For applying the Lee microcell model within 1 mile, there
2
are two different ranges in the three breakpoints from the equations stated previously:
d
P, = P d f -rl log d (4.4.2.1.1)
f