Page 252 - Integrated Wireless Propagation Models
P. 252

230    C h a p t e r  F o u r


                  The position of a mobile as well as a cell site needs to be extremely accurate. Using only
               CPS is not recommended in positioning urban microcell measurement data collection.
               Utilizing both ETAK and CPS is more accurate in collecting measured data. In cities where
               no ETAK data are available, road markers are used to keep track of the positions between
               the cell site and mobiles. Comparisons with collected measurement data demonstrate that
               the model does perform exceptionally well in varying mobile environments with different
               cell site parameters.

               4.3.3  Validation of the Model: Measured versus Predicted
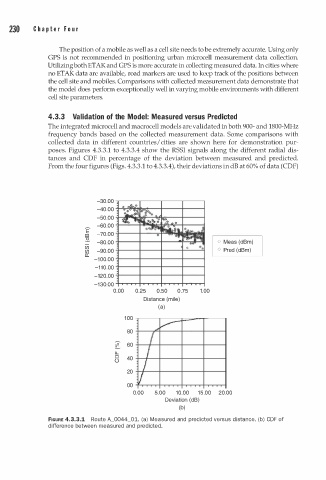
               The integrated microcell and macrocell models are validated in both 900- and 1800-MHz
               frequency bands based on the collected measurement data. Some comparisons with
               collected data in different countries/ cities are shown here for demonstration pur­
               poses. Figures 4.3.3.1 to 4.3.3.4 show the RSSI signals along the different radial dis­
               tances and CDF in percentage of the deviation between measured and predicted.
               From the four figures (Figs. 4.3.3.1 to 4.3.3.4), their deviations in dB at 60% of data (CDF)


                             -30.00
                                    0  .£..0
                             -40.00
                                     �.�  f8'"
                             -50.00
                                    �  �   �t  �0  ,.  o
                             -60.00        ..... .,.
                          E'                    ��1.. �  _}.
                          Ill  -70.00         0     ..
                          :s.   -80.00                 �  . .. ..,.   o  Meas (dBm)
                                                        .....
                          (j)                          0   o,.
                          (f)  -90.00                           o  Pred (dBm)
                          a:
                            -100.00
                             -110.00
                            -120.00
                            -130.00
                                  0.00   0.25   0.50  0.75   1.00
                                           Distance (mile)
                                               (a)
                                     1 0 0
                                               v-
                                      80
                                            I
                                  LL.      I
                                  0   40
                                  (.)
                                          I
                                      20
                                         v
                                      00
                                        0.00   5.00  1 0 .00  1 5 .00  20.00
                                                 Deviation (dB)
                                                     (b)
               FIGURE 4.3.3.1  Route A_0044_01. (a) Measured and predicted versus distance. (b) CDF of
               difference between measured and predicted.
   247   248   249   250   251   252   253   254   255   256   257