
Page 259 - Integrated Wireless Propagation Models
P. 259
M i c r o c e l l P r e d i c t i o n M o d e l s 237
-30
-40
-50
E'
Cll -60
:s
"0 0 .o
Q) -70
u oo
'6
� -80
c...
-90
�
-100
I
1
-1 0
-90 -80 -70 -60 -50 -40 -30 -20
Measured (dBm)
a
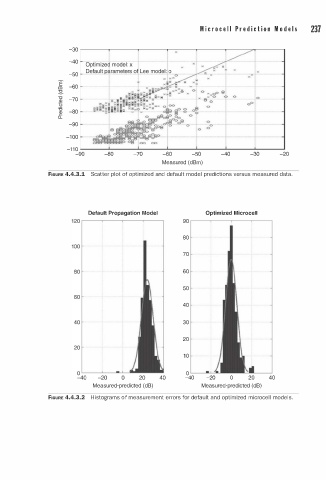
FIGURE 4.4.3.1 Scatter plot of optimized and def u l t model predictions versus measured data.
Default Propagation Model Optimized Microcell
90
80
70
60
50
40
30
20
1 0
0
-40 -20 0 20 40
Measured-predicted (dB) Measured-predicted (dB)
FIGURE 4.4.3.2 Histograms of measurement errors for default and optimized microcel l models.