
Page 304 - Integrated Wireless Propagation Models
P. 304
282 C h a p t e r F i v e
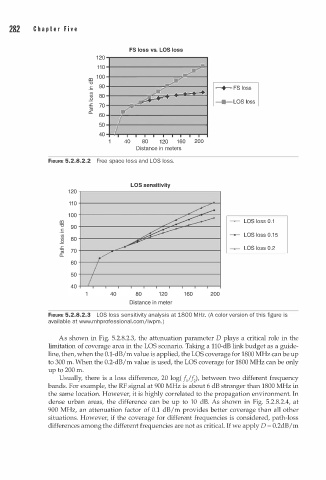
FS loss vs. LOS loss
1 2 0
1 1 0
1 0 0
co
"0
c 90 -+- F S loss
(/) 80
(/)
.2 -LOS loss
£ 70
iii
0..
60
50
40
40 80 1 2 0 1 6 0 200
Distance in meters
FIGURE 5.2.8.2.2 Free space loss and LOS loss.
LOS sensitivity
LOS loss 0.1
LOS loss 0.1 5
LOS loss 0.2
M
FIGURE 5.2.8.2.3 LOS loss sensitivity analysis at 1800 H z. (A color version of this figure is
av i lable at www.mhprofessional.comjiwpm. )
a
A s shown in Fig. 5.2.8.2.3, the attenuation parameter D plays a critical role in the
limitation of coverage area in the LOS scenario. Taking a 110-dB link budget as a guide
line, then, when the 0.1-dB I m value is applied, the LOS coverage for 1800 MHz can be up
to 300 m. When the 0.2-dBim value is used, the LOS coverage for 1800 MHz can be only
up to 200 m.
Usually, there is a loss difference, 20 log( J / J), between two different frequency
2
bands. For example, the RF signal at 900 MHz is about 6 dB stronger than 1800 MHz in
the same location. However, it is highly correlated to the propagation environment. In
dense urban areas, the difference can be up to 10 dB. As shown in Fig. 5.2.8.2.4, at
900 MHz, an attenuation factor of 0.1 dBim provides better coverage than all other
situations. However, if the coverage for different frequencies is considered, path-loss
differences among the different frequencies are not as critical. If we apply D = 0.2dB I m