
Page 299 - Integrated Wireless Propagation Models
P. 299
I n - B u i l d i n g ( P i c o c e l l ) P r e d i c t i o n M o d e l s 271
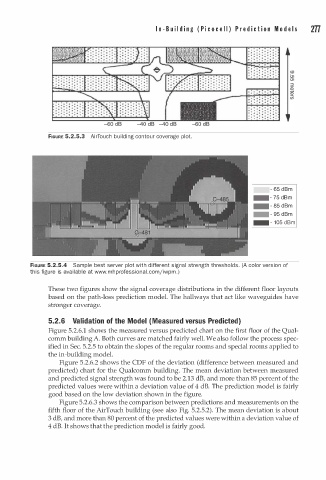
FIGURE 5.2.5.3 AirTouch building contour coverage plot.
- 6 5 dBm
-- 7 5 dBm
- - 8 5 dBm
- - 9 5 dBm
- - 1 0 5 dBm
FIGURE 5.2.5.4 Sample best server plot with different signal strength thresholds. (A color version of
l
this figure is available at www.m h p rofessiona . c omjiwpm. )
These two figures show the signal coverage distributions in the different floor layouts
based on the path-loss prediction model. The hallways that act like waveguides have
stronger coverage.
5.2. 6 Validation of the Model M easured versus Predicted)
(
Figure 5.2.6.1 shows the measured versus predicted chart on the first floor of the Qual
comm building A. Both curves are matched fairly well. We also follow the process spec
ified in Sec. 5.2.5 to obtain the slopes of the regular rooms and special rooms applied to
the in-building model.
Figure 5.2.6.2 shows the CDF of the deviation (difference between measured and
predicted) chart for the Qualcomm building. The mean deviation between measured
and predicted signal strength was found to be 2.13 dB, and more than 85 percent of the
predicted values were within a deviation value of 4 dB. The prediction model is fairly
good based on the low deviation shown in the figure.
Figure 5.2.6.3 shows the comparison between predictions and measurements on the
fifth floor of the AirTouch building (see also Fig. 5.2.5.2). The mean deviation is about
3 dB, and more than 80 percent of the predicted values were within a deviation value of
4 dB. It shows that the prediction model is fairly good.