
Page 298 - Integrated Wireless Propagation Models
P. 298
276 C h a p t e r F i v e
Node 3 Node 2 Node 1
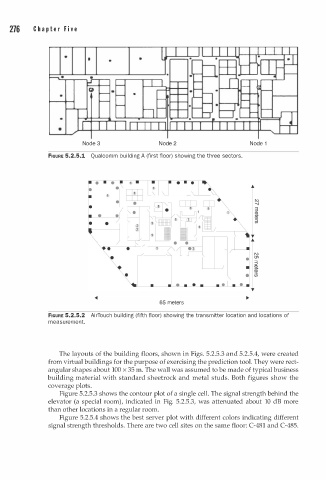
FIGURE 5.2.5.1 Qualcomm building A (first floor) showing the three sectors .
•
•
1\)
01
3
, �
• • •
�1-----------------------------------------1�
65 meters
FIGURE 5.2.5.2 AirTouch building (fifth floor) showing the transmitter location and locations of
measurement.
The layouts of the building floors, shown in Figs. 5.2.5.3 and 5.2.5.4, were created
from virtual buildings for the purpose of exercising the prediction tool. They were rect
angular shapes about 100 x 35 m. The wall was assumed to be made of typical business
building material with standard sheetrock and metal studs. Both figures show the
coverage plots.
Figure 5.2.5.3 shows the contour plot of a single cell. The signal strength behind the
elevator (a special room), indicated in Fig. 5.2.5.3, was attenuated about 10 dB more
than other locations in a regular room.
Figure 5.2.5.4 shows the best server plot with different colors indicating different
signal strength thresholds. There are two cell sites on the same floor: C-481 and C-485.