Page 300 - Integrated Wireless Propagation Models
P. 300

278    C h a p t e r   F i v e


                                                Measured


                          0.00                   30.00                    60.00
                                            Measurement point (X)
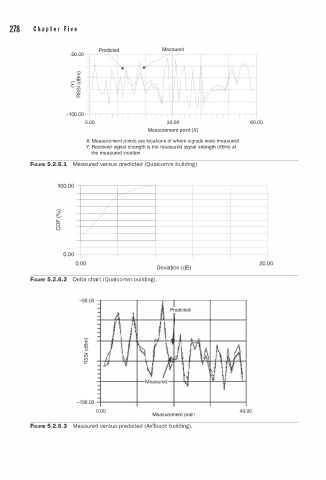
                          X: Measurement points are locations of where signals were measured
                          Y: Received signal strength is the measured signal strength (dBm) at
                            the measured location
          FIGURE 5.2.6.1  Measured versus predicted (Qualcomm building).


                  1 0 0.00
                                      �
                                /
                               I
                             /
                 LL
                 0          �
                 ()
                         /
                   0.00
                       0.00                                                 20.00
                                               Deviation (dB)
          FIGURE 5.2.6.2  Delta chart (Qualcomm building).


                         E
                         aJ
                         :3.
                         i.i:
                         (/)
                         a:


                             0.00                                      40.00
                                             Measurement point
          FIGURE 5.2.6.3  Measured versus predicted (AirTouch building).
   295   296   297   298   299   300   301   302   303   304   305