
Page 305 - Integrated Wireless Propagation Models
P. 305
I n - B u i l d i n g ( P i c o c e l l ) P r e d i c t i o n M o d e l s 283
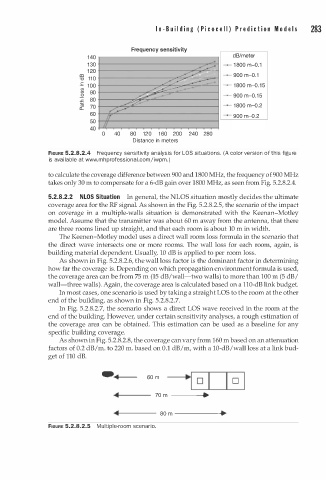
Frequency sensitivity
1 4 0 dB/meter
1 3 0 1 8 00 m- . 1
0
1 2 0
co
""0 1 1 0
.� 1 0 0
(/)
(/)
_Q 90
.<:: 80
1ii 70
c...
60 900 m-0.2
50
40
0 40 80 120 1 6 0 200 240 280
Distance in meters
FIGURE 5.2.8.2.4 Frequency sensitivity analysis for LOS situations. (A color version of this figure
a
is av i l able at www.m h p rofessional.comjiwpm. )
to calculate the coverage difference between 900 and 1800 MHz, the frequency f 900 MHz
o
takes only 30 m to compensate for a 6-dB gain over 1800 MHz, as seen from Fig. 5.2.8.2.4.
5.2.8.2.2 NLOS Situation In general, the NLOS situation mostly decides the ultimate
coverage area for the RF signal. As shown in the Fig. 5.2.8.2.5, the scenario of the impact
on coverage in a multiple-walls situation is demonstrated with the Keenan-Motley
model. Assume that the transmitter was about 60 m away from the antenna, that there
are three rooms lined up straight, and that each room is about 10 i n width.
m
The Keenen-Motley model uses a direct wall room loss formula in the scenario that
the direct wave intersects one or more rooms. The wall loss for each room, again, is
building material dependent. Usually, 10 dB is applied to per room loss.
As shown in Fig. 5.2.8.2.6, the wall loss factor is the dominant factor in determining
how far the coverage is. Depending on which propagation environment formula is used,
the coverage area can be from 75 m (15 dB/wall-two walls) to more than 100 m (5 dB/
wall-three walls). Again, the coverage area is calculated based on a 110-dB link budget.
In most cases, one scenario is used by taking a straight LOS to the room at the other
end of the building, as shown in Fig. 5.2.8.2.7.
In Fig. 5.2.8.2.7, the scenario shows a direct LOS wave received in the room at the
end of the building. However, under certain sensitivity analyses, a rough estimation of
the coverage area can be obtained. This estimation can be used as a baseline for any
specific building coverage.
As shown in Fig. 5.2.8.2.8, the coverage can vary from 160 m based on an attenuation
factors of 0.2 dB/m. to 220 m. based on 0.1 dB/m, with a 10-dB/wall loss at a link bud
get of 110 dB.
-·'4- 60 m
D
70 m ------11Jr...-
80 m -------IIJr.
FIGURE 5.2.8.2.5 M u l tiple-room scenario.