
Page 309 - Integrated Wireless Propagation Models
P. 309
I n - B u i l d i n g ( P i c o c e l l ) P r e d i c t i o n M o d e l s 287
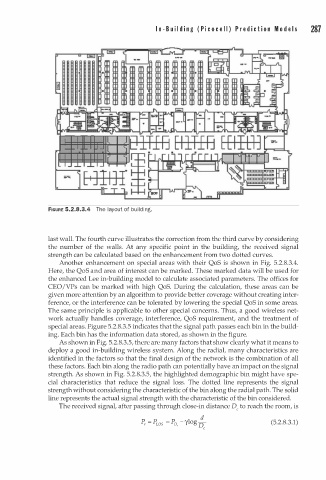
FIGURE 5.2.8.3.4 The layout of building.
last wall. The fourth curve illustrates the correction from the third curve by considering
the number of the walls. At any specific point in the building, the received signal
strength can be calculated based on the enhancement from two dotted curves.
Another enhancement on special areas with their QoS is shown in Fig. 5.2.8.3.4.
Here, the QoS and area of interest can be marked. These marked data will be used for
the enhanced Lee in-building model to calculate associated parameters. The offices for
CEO /VPs can be marked with high QoS. During the calculation, these areas can be
given more attention by an algorithm to provide better coverage without creating inter
ference, or the interference can be tolerated by lowering the special QoS in some areas.
The same principle is applicable to other special concerns. Thus, a good wireless net
work actually handles coverage, interference, QoS requirement, and the treatment of
special areas. Figure 5.2.8.3.5 indicates that the signal path passes each bin in the build
ing. Each bin has the information data stored, as shown in the figure.
As shown in Fig. 5.2.8.3.5, there are many factors that show clearly what it means to
deploy a good in-building wireless system. Along the radial, many characteristics are
identified in the factors so that the final design of the network is the combination of all
these factors. Each bin along the radio path can potentially have an impact on the signal
strength. As shown in Fig. 5.2.8.3.5, the highlighted demographic bin might have spe
cial characteristics that reduce the signal loss. The dotted line represents the signal
strength without considering the characteristic of the bin along the radial path. The solid
line represents the actual signal strength with the characteristic of the bin considered.
The received signal, after passing through close-in distance D, to reach the room, is
d
-
P, = P ws = P o, y log 0 (5.2.8.3.1)
c