
Page 308 - Integrated Wireless Propagation Models
P. 308
286 C h a p t e r F i v e
...._ FS-Ioss d1
d ws
Ui -p-. :
d t �LOS-loss :
CfJ
P , """- ���-/7
a: !' Blocked wall
! "
Free space
i
Close-in Y /
distance
1 1
I
I
' .
FIGURE 5.2.8.3.2 I l l u stration of the enhancement by adding losses blocked by walls.
can meet the QoS requirement and is more cost effective. The enhancement gained by
adding the loss due to the blocks of waves by walls is illustrated in Fig. 5.2.8.3.2.
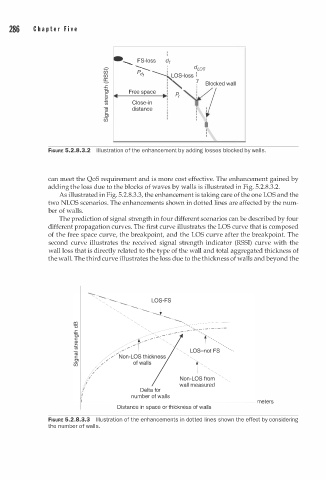
As illustrated in Fig. 5.2.8.3.3, the enhancement is taking care of the one LOS and the
two NLOS scenarios. The enhancements shown in dotted lines are affected by the num
ber of walls.
The prediction of signal strength in four different scenarios can be described by four
different propagation curves. The first curve illustrates the LOS curve that is composed
of the free space curve, the breakpoint, and the LOS curve after the breakpoint. The
second curve illustrates the received signal strength indicator (RSSI) curve with the
wall loss that is directly related to the type of the wall and total aggregated thickness of
the wall. The third curve illustrates the loss due to the thickness of walls and beyond the
/
/
/
I
I wall measured
I Delta for
I number of walls
-1'------------------------- meters
Distance in space or thickness of walls
FIGURE 5.2.8.3.3 Illustration of the enhancements in dotted lines shown the effect by considering
the number of walls.