
Page 40 - Integrated Wireless Propagation Models
P. 40
18 C h a p t e r O n e
o o
o o
+10 dB +20 dB
o
o
+20 dB
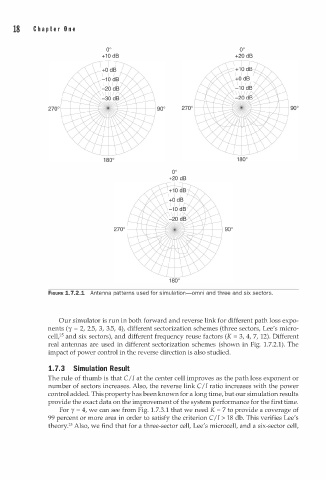
FIGURE 1.7.2.1 Antenna patterns used for simulation-omni and three and six sectors.
Our simulator is run in both forward and reverse link for different path loss expo
nents (y = 2, 2.5, 3, 3.5, 4), different sectorization schemes (three sectors, Lee's micro
cell/5 and six sectors), and different frequency reuse factors (K = 3, 4, 7, 12). Different
real antennas are used in different sectorization schemes (shown in Fig. 1 . 7.2.1). The
impact of power control in the reverse direction is also studied.
1 . 7.3 Simulation Result
The rule of thumb is that C!I at the center cell improves as the path loss exponent or
number of sectors increases. Also, the reverse link C/I ratio increases with the power
control added. This property has been known for a long time, but our simulation results
provide the exact data on the improvement of the system performance for the first time.
.
For y = 4, we can see from Fig. . 7.3 1 that we need K = 7 to provide a coverage of
1
99 percent or more area in order to satisfy the criterion C/I > 18 db. This verifies Lee's
2
theory. 5 Also, we find that for a three-sector cell, Lee's microcell, and a six-sector cell,