
Page 42 - Integrated Wireless Propagation Models
P. 42
20 C h a p t e r O n e
1 0 0 - - -
-
-
r
90
I
80
Q) I
Cl 70
ctl
c
Q) I
� 60
Q)
c..
c I
0 50 -+- Omni
u
� I -- 3_Sector
en 40
� -r- 6_Sector
en I
(J 30
I
20
I
1 0
I
0
3K 4K 7K 1 2 K
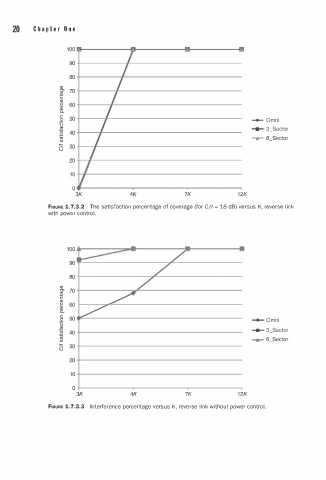
FIGURE 1.7.3.2 The satisfaction percentage of coverage (for C/1 = 18 dB) versus K, reverse i n k
l
with power contr l .
o
1 0 0 - - -
lv--- /
90
/
80
Q) /
Cl 70
ctl
c
Q) _/
� 60
Q)
c _/'
c..
0 50 ....... omni
t5
� _ 3 _Sector
en 40
�
en -r- 6_Sector
(J 30
20
1 0
0
3K 4K 7K 1 2 K
FIGURE 1.7.3.3 Interference percentage versus K, reverse link without power contro l .