
Page 44 - Integrated Wireless Propagation Models
P. 44
22 C h a p t e r O n e
0.2
0. 1 8
0. 1 6
0.14
0.12
IK -+- K = 3
/1 0.1 -- K = 4
0.08 ...,._ K = 7
-- K = 1 2
0.06
0.04
0.02
0
2nd tier 3rd tier 4th tier
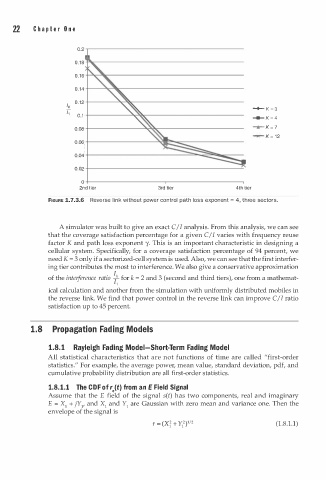
FIGURE 1.7.3.6 Reverse l i n k without power control path loss exponent = 4, three sectors.
A simulator was built to give an exact C/I analysis. From this analysis, we can see
that the coverage satisfaction percentage for a given C/ I varies with frequency reuse
factor K and path loss exponent y. This is an important characteristic in designing a
cellular system. Specifically, for a coverage satisfaction percentage of 94 percent, we
need K = 3 only if a sectorized-cell system is used. Also, we can see that the first interfer
ing tier contributes the most to interference. We also give a conservative approximation
of the inter e rence ratio ik for k = 2 and 3 (second and third tiers), one from a mathemat-
f
1
ical calculation and another from the simulation with uniformly distributed mobiles in
the reverse link. We find that power control in the reverse link can improve C/I ratio
satisfaction up to 45 percent.
1.8 Propagation Fa i ng Models
d
1.8.1 Rayleigh Fading Model-Short-Term Fading Model
All statistical characteristics that are not functions of time are called "first-order
statistics." For example, the average power, mean value, standard deviation, pdf, and
cumulative probability distribution are all first-order statistics.
a
C
1.8. 1 . 1 The D F o f r.(t) from n E Field Signal
Assume that the E field of the signal s(t) has two components, real and imaginary
E = X1 + jY1, and X1 and Y1 are Gaussian with zero mean and variance one. Then the
envelope of the signal is
(1.8.1.1)