
Page 47 - Integrated Wireless Propagation Models
P. 47
I n t r o d u c t i o n t o M o d e l i n g M o b i l e S i g n a l s i n W i r e l e s s C o m m u n i c a t i o n s 25
-70
Peak sampling
-80
-90
-130
-140
-150 �--------------------�------------------�
0 0.5 1.0
RF noise measurements form Newark-1 s of elapsed time
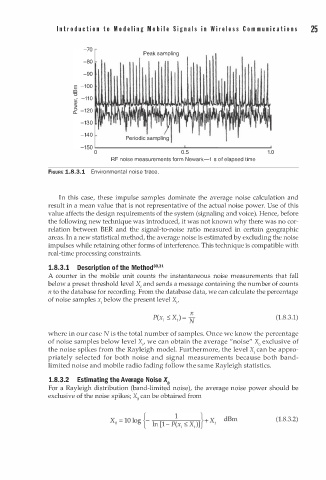
FIGURE 1.8.3.1 Environmental noise trace.
In this case, these impulse samples dominate the average noise calculation and
result in a mean value that is not representative of the actual noise power. Use of this
value affects the design requirements of the system (signaling and voice). Hence, before
the following new technique was introduced, it was not known why there was no cor
relation between BER and the signal-to-noise ratio measured in certain geographic
areas. In a new statistical method, the average noise is estimated by excluding the noise
impulses while retaining other forms of interference. This technique is compatible with
real-time processing constraints.
0
o
3
1.8. . 1 Description f the Method3 ·31
A counter in the mobile unit counts the instantaneous noise measurements that fall
below a preset threshold level X, and sends a message containing the number of counts
n to the database for recording. From the database data, we can calculate the percentage
\
of noise samples b elow the present level X ,,
(1.8.3.1)
where in our case N is the total number of samples. Once we know the percentage
of noise samples below level X ,, we can obtain the average "noise" X 0 exclusive of
the noise spikes from the Rayleigh model. Furthermore, the level X , can be appro
b
priately selected for o th noise and signal measurements because both band
limited noise and mobile radio fading follow the same Rayleigh statistics.
1.8.3.2 Estimating the Average Noise X 0
For a Rayleigh distribution (band-limited noise), the average noise power should be
exclusive of the noise spikes; X 0 can be obtained from
(1.8.3.2)