
Page 243 - Introduction to Colloid and Surface Chemistry
P. 243
232 Colloid stability
electrolytes and 4.8 for 2-2 electrolytes, whereas the more exact
96
calculations via equation (8.20) give slopes of 7 and 4.5, respectively .
Coagulation rates have been measured as a function of electrolyte
96 196 204 206
concentration for a number of SO} S . > - ? an<j the predicted
linear relationship between log W and log c in the slow-coagulation
region seems to be well confirmed. In addition, the experimental
values of d log W/d log c, although somewhat variable, are of the
right order of magnitude compared with theoretical slopes.
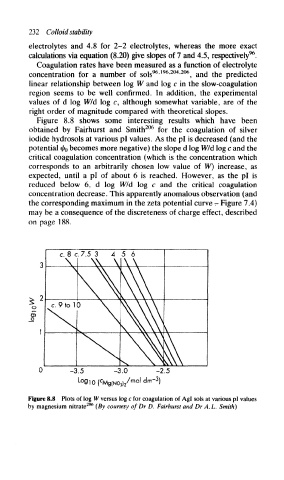
Figure 8.8 shows some interesting results which have been
206
obtained by Fairhurst and Smith for the coagulation of silver
iodide hydrosols at various pi values. As the pi is decreased (and the
potential i/f 0 becomes more negative) the slope d log W/d log c and the
critical coagulation concentration (which is the concentration which
corresponds to an arbitrarily chosen low value of W) increase, as
expected, until a pi of about 6 is reached. However, as the pi is
reduced below 6, d log W/d log c and the critical coagulation
concentration decrease. This apparently anomalous observation (and
the corresponding maximum in the zeta potential curve - Figure 7.4)
may be a consequence of the discreteness of charge effect, described
on page 188.
c. 8 c. 7.5 3 4 5 6
-3.5 -3.0 -2.5
L c moldm 3
°9lO( Mg(N0 3)/ ~ )
Figure 8.8 Plots of log W versus log c for coagulation of Agl sols at various pi values
by magnesium nitrate 206 (By courtesy of Dr D. Fairhurst and Dr A.L. Smith)