
Page 219 - Introduction to Computational Fluid Dynamics
P. 219
P1: IWV
CB908/Date
May 25, 2005
11:10
0521853265c06
198
2D CONVECTION – COMPLEX DOMAINS
VELOCITY VECTORS 0 521 85326 5 KINETIC ENERGY TURBULENT VISCOSITY
Re = 12000
Re = 81550
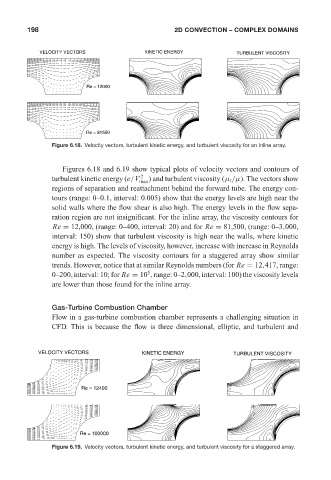
Figure 6.18. Velocity vectors, turbulent kinetic energy, and turbulent viscosity for an inline array.
Figures 6.18 and 6.19 show typical plots of velocity vectors and contours of
turbulent kinetic energy (e/V 2 ) and turbulent viscosity (µ t /µ). The vectors show
max
regions of separation and reattachment behind the forward tube. The energy con-
tours (range: 0–0.1, interval: 0.005) show that the energy levels are high near the
solid walls where the flow shear is also high. The energy levels in the flow sepa-
ration region are not insignificant. For the inline array, the viscosity contours for
Re = 12,000, (range: 0–400, interval: 20) and for Re = 81,500, (range: 0–3,000,
interval: 150) show that turbulent viscosity is high near the walls, where kinetic
energy is high. The levels of viscosity, however, increase with increase in Reynolds
number as expected. The viscosity contours for a staggered array show similar
trends. However, notice that at similar Reynolds numbers (for Re = 12,417, range:
5
0–200, interval: 10; for Re = 10 , range: 0–2,000, interval: 100) the viscosity levels
are lower than those found for the inline array.
Gas-Turbine Combustion Chamber
Flow in a gas-turbine combustion chamber represents a challenging situation in
CFD. This is because the flow is three dimensional, elliptic, and turbulent and
VELOCITY VECTORS KINETIC ENERGY TURBULENT VISCOSITY
Re = 12400
Re = 100000
Figure 6.19. Velocity vectors, turbulent kinetic energy, and turbulent viscosity for a staggered array.