Page 213 - Introduction to Mineral Exploration
P. 213

196   C.J. MOON & M.K.G. WHATELEY


                  55,000


                  50,000


                  45,000
                                  5
                                         km
                         N
                       250,000      255,000     260,000     265,000      270,000     275,000     280,000


                         Legend                        Probability
                                                                                     0.03–0.10
                                   Prospect                  0.00
                                                                                     0.11–0.40
                                   Coast
                                                             0.01–0.02
                                                                                     0.41–0.52
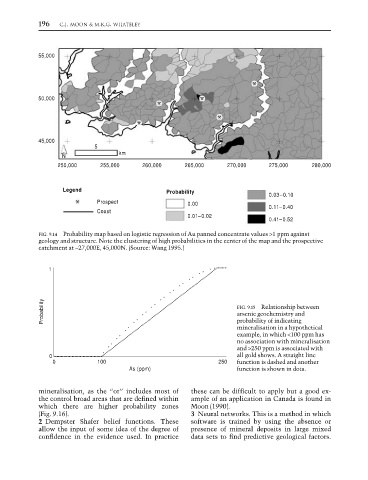
                  FIG. 9.14 Probability map based on logistic regression of Au panned concentrate values >1 ppm against
                  geology and structure. Note the clustering of high probabilities in the center of the map and the prospective
                  catchment at ~27,000E, 45,000N. (Source: Wang 1995.)


                     1


                   Probability                                              FIG. 9.15  Relationship between
                                                                            arsenic geochemistry and
                                                                            probability of indicating
                                                                            mineralisation in a hypothetical
                                                                            example, in which <100 ppm has
                                                                            no association with mineralisation
                                                                            and >250 ppm is associated with
                     0                                                      all gold shows. A straight line
                      0            100                                250   function is dashed and another
                                            As (ppm)                        function is shown in dots.


                  mineralisation, as the “or” includes most of  these can be difficult to apply but a good ex-
                  the control broad areas that are defined within  ample of an application in Canada is found in
                  which there are higher probability zones    Moon (1990).
                  (Fig. 9.16).                                3 Neural networks. This is a method in which
                  2 Dempster Shafer belief functions. These   software is trained by using the absence or
                  allow the input of some idea of the degree of  presence of mineral deposits in large mixed
                  confidence in the evidence used. In practice  data sets to find predictive geological factors.
   208   209   210   211   212   213   214   215   216   217   218