
Page 218 - Introduction to Mineral Exploration
P. 218
10: EVALUATION TECHNIQUES 201
Variance units are the square of the units of In asymmetrical distributions there is
the original observation. A small variance indi- no comparable relationship between standard
cates that observations are clustered tightly deviation (or variance) and the area under the
about the arithmetic mean whilst a large vari- distribution curve, as in a normal counterpart.
ance shows that they are scattered widely about Consequently, mathematical transformations
the mean, and that their central clustering is have been used whereby skewed data are trans-
weak. A useful property of a normal distribu- formed to normal. Perhaps the commonest
tion is that within any specified range, areas is the log normal transformation where the
under its curve can be exactly calculated. For natural log of all values is used as the distri-
example, slightly over two-thirds (68%) of all bution and many geological data approxim-
observations are within one standard deviation ate to this type of distribution; however, this
on either side of the arithmetic mean and method should be used with caution. Geovari-
95% of all values are within ±2 (actually 1.96) ances (2001) recommend the use of gaussian
standard deviations from the mean (Fig. 10.2). transformation particularly for variable trans-
The mean of observations, or average, is their formation in the geostatistical conditional
total sum divided by the number of observa- simulation process (see section 10.4.3) and for
tions, n. use in nonlinear geostatisical techniques such
as disjunctive kriging and uniform condition-
Asymmetrical distributions ing (Deutsch 2002). An alternative approach is
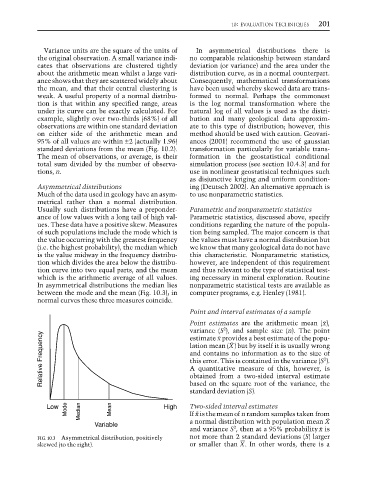
Much of the data used in geology have an asym- to use nonparametric statistics.
metrical rather than a normal distribution.
Usually such distributions have a preponder- Parametric and nonparametric statistics
ance of low values with a long tail of high val- Parametric statistics, discussed above, specify
ues. These data have a positive skew. Measures conditions regarding the nature of the popula-
of such populations include the mode which is tion being sampled. The major concern is that
the value occurring with the greatest frequency the values must have a normal distribution but
(i.e. the highest probability), the median which we know that many geological data do not have
is the value midway in the frequency distribu- this characteristic. Nonparametric statistics,
tion which divides the area below the distribu- however, are independent of this requirement
tion curve into two equal parts, and the mean and thus relevant to the type of statistical test-
which is the arithmetic average of all values. ing necessary in mineral exploration. Routine
In asymmetrical distributions the median lies nonparametric statistical tests are available as
between the mode and the mean (Fig. 10.3); in computer programs, e.g. Henley (1981).
normal curves these three measures coincide.
Point and interval estimates of a sample
Point estimates are the arithmetic mean (X),
2
variance (S ), and sample size (n). The point
Relative Frequency lation mean (Y) but by itself it is usually wrong
estimate X provides a best estimate of the popu-
and contains no information as to the size of
2
this error. This is contained in the variance (S ).
A quantitative measure of this, however, is
obtained from a two-sided interval estimate
based on the square root of the variance, the
standard deviation (S).
Mode Median Mean If X is the mean of n random samples taken from
Low High Two-sided interval estimates
Variable a normal distribution with population mean Y
2
and variance S , then at a 95% probabilityX is
FIG. 10.3 Asymmetrical distribution, positively not more than 2 standard deviations (S) larger
skewed (to the right). or smaller than X. In other words, there is a