
Page 223 - Introduction to Mineral Exploration
P. 223
206 M.K.G. WHATELEY & B. SCOTT
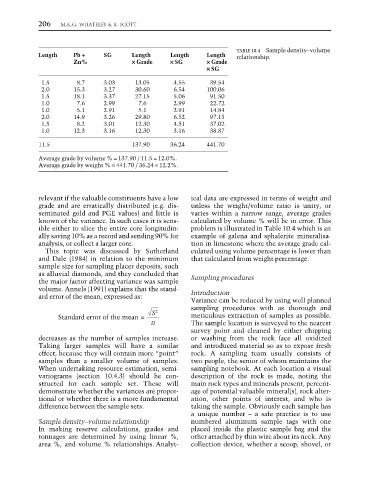
TABLE 10.4 Sample density–volume
Length Pb ++ ++ + SG Length Length Length relationship.
Zn% × × × × × Grade × × × × × SG × × × × × Grade
× × × × × SG
1.5 8.7 3.03 13.05 4.55 39.54
2.0 15.3 3.27 30.60 6.54 100.06
1.5 18.1 3.37 27.15 5.06 91.50
1.0 7.6 2.99 7.6 2.99 22.72
1.0 5.1 2.91 5.1 2.91 14.84
2.0 14.9 3.26 29.80 6.52 97.15
1.5 8.2 3.01 12.30 4.51 37.02
1.0 12.3 3.16 12.30 3.16 38.87
11.5 137.90 36.24 441.70
Average grade by volume % = 137.90 / 11.5 = 12.0%.
Average grade by weight % = 441.70 / 36.24 = 12.2%.
relevant if the valuable constituents have a low ical data are expressed in terms of weight and
grade and are erratically distributed (e.g. dis- unless the weight/volume ratio is unity, or
seminated gold and PGE values) and little is varies within a narrow range, average grades
known of the variance. In such cases it is sens- calculated by volume % will be in error. This
ible either to slice the entire core longitudin- problem is illustrated in Table 10.4 which is an
ally saving 10% as a record and sending 90% for example of galena and sphalerite mineralisa-
analysis, or collect a larger core. tion in limestone where the average grade cal-
This topic was discussed by Sutherland culated using volume percentage is lower than
and Dale (1984) in relation to the minimum that calculated from weight percentage.
sample size for sampling placer deposits, such
as alluvial diamonds, and they concluded that Sampling procedures
the major factor affecting variance was sample
volume. Annels (1991) explains that the stand- Introduction
ard error of the mean, expressed as:
Variance can be reduced by using well planned
sampling procedures with as thorough and
S 2
=
Standard error of the mean meticulous extraction of samples as possible.
n The sample location is surveyed to the nearest
survey point and cleaned by either chipping
decreases as the number of samples increase. or washing from the rock face all oxidized
Taking larger samples will have a similar and introduced material so as to expose fresh
effect, because they will contain more “point” rock. A sampling team usually consists of
samples than a smaller volume of samples. two people, the senior of whom maintains the
When undertaking resource estimation, semi- sampling notebook. At each location a visual
variograms (section 10.4.3) should be con- description of the rock is made, noting the
structed for each sample set. These will main rock types and minerals present, percent-
demonstrate whether the variances are propor- age of potential valuable mineral(s), rock alter-
tional or whether there is a more fundamental ation, other points of interest, and who is
difference between the sample sets. taking the sample. Obviously each sample has
a unique number – a safe practice is to use
Sample density–volume relationship numbered aluminum sample tags with one
In making reserve calculations, grades and placed inside the plastic sample bag and the
tonnages are determined by using linear %, other attached by thin wire about its neck. Any
area %, and volume % relationships. Analyt- collection device, whether a scoop, shovel, or