
Page 220 - Introduction to Mineral Exploration
P. 220
10: EVALUATION TECHNIQUES 203
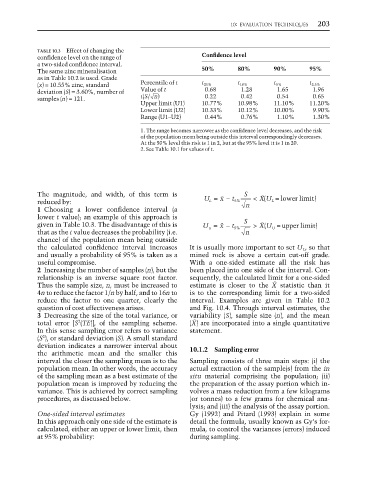
TABLE 10.3 Effect of changing the
confidence level on the range of Confidence level
a two-sided confidence interval.
The same zinc mineralisation 50% 80% 90% 95%
as in Table 10.2 is used. Grade
(x) = 10.55% zinc, standard Percentile of t t 25% t 10% t 5% t 2.5%
deviation (S) = 3.60%, number of Value of t 0.68 1.28 1.65 1.96
samples (n) = 121. t(S/ n) 0.22 0.42 0.54 0.65
Upper limit (U1) 10.77% 10.98% 11.10% 11.20%
Lower limit (U2) 10.33% 10.12% 10.00% 9.90%
Range (U1–U2) 0.44% 0.76% 1.10% 1.30%
1. The range becomes narrower as the confidence level decreases, and the risk
of the population mean being outside this interval correspondingly decreases.
At the 50% level this risk is 1 in 2, but at the 95% level it is 1 in 20.
2. See Table 10.1 for values of t.
The magnitude, and width, of this term is S
X
L
reduced by: U = − t 5 % n < Y(U L = lower limit)
1 Choosing a lower confidence interval (a
lower t value); an example of this approach is
−
=
>
given in Table 10.3. The disadvantage of this is U u t %5 S Y(U U = upper limit)
X
that as the t value decreases the probability (i.e. n
chance) of the population mean being outside
the calculated confidence interval increases It is usually more important to set U L , so that
and usually a probability of 95% is taken as a mined rock is above a certain cut-off grade.
useful compromise. With a one-sided estimate all the risk has
2 Increasing the number of samples (n), but the been placed into one side of the interval. Con-
relationship is an inverse square root factor. sequently, the calculated limit for a one-sided
Thus the sample size, n, must be increased to estimate is closer to the Y statistic than it
4n to reduce the factor 1/n by half, and to 16n to is to the corresponding limit for a two-sided
reduce the factor to one quarter, clearly the interval. Examples are given in Table 10.2
question of cost effectiveness arises. and Fig. 10.4. Through interval estimates, the
3 Decreasing the size of the total variance, or variability (S), sample size (n), and the mean
2
total error [S (TE)], of the sampling scheme. (Y) are incorporated into a single quantitative
In this sense sampling error refers to variance statement.
2
(S ), or standard deviation (S). A small standard
deviation indicates a narrower interval about
the arithmetic mean and the smaller this 10.1.2 Sampling error
interval the closer the sampling mean is to the Sampling consists of three main steps: (i) the
population mean. In other words, the accuracy actual extraction of the sample(s) from the in
of the sampling mean as a best estimate of the situ material comprising the population; (ii)
population mean is improved by reducing the the preparation of the assay portion which in-
variance. This is achieved by correct sampling volves a mass reduction from a few kilograms
procedures, as discussed below. (or tonnes) to a few grams for chemical ana-
lysis; and (iii) the analysis of the assay portion.
One-sided interval estimates Gy (1992) and Pitard (1993) explain in some
In this approach only one side of the estimate is detail the formula, usually known as Gy’s for-
calculated, either an upper or lower limit, then mula, to control the variances (errors) induced
at 95% probability: during sampling.