Page 219 - Introduction to Mineral Exploration
P. 219

202   M.K.G. WHATELEY & B. SCOTT


                  95% chance that the population mean is in this  TABLE 10.2 Two-sided and one-sided confidence
                  calculated interval and five chances in a hun-  intervals at 95% probability.
                  dred that it is outside. The relationship is:
                                                                               Two-sided      One-sided
                               . 196σ         . 1 96σ
                                        >
                                            −
                            +
                                    >
                          X           Y   Y                   X                10.55% Zn      10.55% Zn
                                    n           n             S                3.60%          3.60%
                                                              n                121            121
                  This method is correct but useless because we    n           11             11
                  do not know σ and the expression becomes:   (S/ n)           0.33           0.33

                                                                               1.96           NA
                                                              t 2.5%
                                 S               S
                           +
                                        >
                                           −
                                    >
                         X   t 25     Y   X   t 25            t 5%             NA             1.65
                                              .%
                              .%
                                   n              n           t(S/    n)       0.65           0.54
                                                              Upper limit      11.20%         NA
                  where σ is replaced by its best estimate S, and  Lower limit  9.90%         10.01%
                  the normal distribution is replaced by a dis-
                  tribution which has a wider spread than the  1. The total number of samples needed to halve the
                                                              standard error of the mean (S/ n), and thus the range of the

                  normal case. In this t distribution (Davis 2003)  confidence interval, is 484 [= (2 × 11) ].
                                                                                       2
                  the shape of its distribution curve varies ac-  2. With a one-sided confidence interval all the risk is
                  cording to the number of samples (n) used to es-  placed into one side of the interval. Consequently the
                  timate the population parameters (Table 10.1).  calculated limit is closer to the x statistic than to the
                  As n increases, however, the curve resembles  corresponding limit for a two-sided interval. In the above
                                                              example the upper limit could have been calculated instead
                  that of the normal case and for all practical pur-  of the lower.
                  poses for more than 50 samples the curves are  3. See Table 10.1 for t values and Fig. 10.4 for a graphical
                  identical. Examples of the use of this formula  representation.
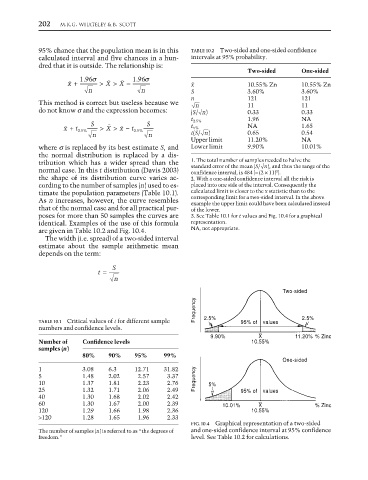
                  are given in Table 10.2 and Fig. 10.4.      NA, not appropriate.
                    The width (i.e. spread) of a two-sided interval
                  estimate about the sample arithmetic mean
                  depends on the term:
                                       S
                                     =
                                   t
                                          n
                                                                                         Two-sided
                                                               Frequency
                  TABLE 10.1 Critical values of t for different sample  2.5%  95% of  values   2.5%
                  numbers and confidence levels.
                                                                    9.90%         X          11.20% % Zinc
                  Number of    Confidence levels                                 10.55%
                  samples (n)
                               80%    90%     95%     99%
                                                                                         One-sided
                  1            3.08   6.3     12.71   31.82
                  5            1.48   2.02     2.57    3.37    Frequency
                  10           1.37   1.81     2.23    2.76        5%
                  25           1.32   1.71     2.06    2.49                  95% of  values
                  40           1.30   1.68     2.02    2.42
                  60           1.30   1.67     2.00    2.39            10.01%     X               % Zinc
                  120          1.29   1.66     1.98    2.36                     10.55%
                  >120         1.28   1.65     1.96    2.33
                                                              FIG. 10.4  Graphical representation of a two-sided
                  The number of samples (n) is referred to as “the degrees of  and one-sided confidence interval at 95% confidence
                  freedom.”                                   level. See Table 10.2 for calculations.
   214   215   216   217   218   219   220   221   222   223   224