
Page 214 - Introduction to Mineral Exploration
P. 214
9: MINERAL EXPLORATION DATA 197
55,000
50,000
45,000
5
km
N
250,000 255,000 260,000 265,000 270,000 275,000 280,000
Probability 0.40–0.55
Legend
no data 0.55–0.65
Prospect
Coast < 0.25 0.65–0.75
0.25–0.40 >0.75
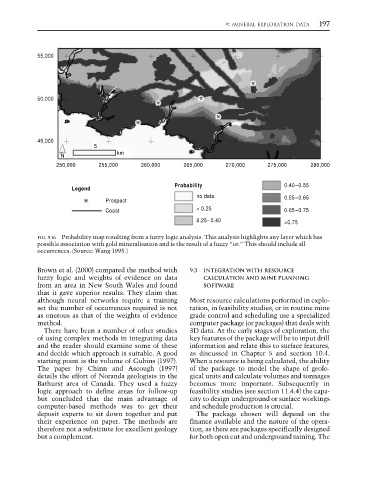
FIG. 9.16 Probability map resulting from a fuzzy logic analysis. This analysis highlights any layer which has
possible association with gold mineralisation and is the result of a fuzzy “or.” This should include all
occurrences. (Source: Wang 1995.)
Brown et al. (2000) compared the method with 9.3 INTEGRATION WITH RESOURCE
fuzzy logic and weights of evidence on data CALCULATION AND MINE PLANNING
from an area in New South Wales and found SOFTWARE
that it gave superior results. They claim that
although neural networks require a training Most resource calculations performed in explo-
set the number of occurrences required is not ration, in feasibility studies, or in routine mine
as onerous as that of the weights of evidence grade control and scheduling use a specialized
method. computer package (or packages) that deals with
There have been a number of other studies 3D data. At the early stages of exploration, the
of using complex methods in integrating data key features of the package will be to input drill
and the reader should examine some of these information and relate this to surface features,
and decide which approach is suitable. A good as discussed in Chapter 5 and section 10.4.
starting point is the volume of Gubins (1997). When a resource is being calculated, the ability
The paper by Chinn and Ascough (1997) of the package to model the shape of geolo-
details the effort of Noranda geologists in the gical units and calculate volumes and tonnages
Bathurst area of Canada. They used a fuzzy becomes more important. Subsequently in
logic approach to define areas for follow-up feasibility studies (see section 11.4.4) the capa-
but concluded that the main advantage of city to design underground or surface workings
computer-based methods was to get their and schedule production is crucial.
deposit experts to sit down together and put The package chosen will depend on the
their experience on paper. The methods are finance available and the nature of the opera-
therefore not a substitute for excellent geology tion, as there are packages specifically designed
but a complement. for both open cut and underground mining. The