
Page 217 - Introduction to Mineral Exploration
P. 217
200 M.K.G. WHATELEY & B. SCOTT
tion. Mineralisation is composed of dissimilar
constituents and is heterogeneous – it is rarely
(if ever) homogenous – and correct sampling of
such material has to ensure that all constituent
Frequency ability of being selected to form the sample,
units of the population have a uniform prob-
and the integrity of the sample is respected (see
X 1
X 2 later). This is the concept of random sampling.
Normal and asymmetrical distributions
Low Variable High This is a brief introduction to the subject of dis-
tributions. The reader is referred to standard
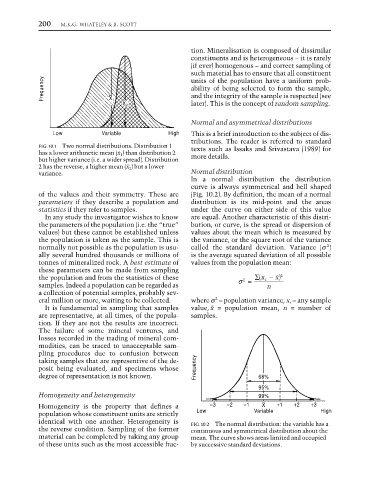
FIG. 10.1 Two normal distributions. Distribution 1 texts such as Issaks and Srivastava (1989) for
has a lower arithmetic mean (X 1 ) than distribution 2 more details.
but higher variance (i.e. a wider spread). Distribution
2 has the reverse, a higher mean (X 2 ) but a lower
variance. Normal distribution
In a normal distribution the distribution
curve is always symmetrical and bell shaped
of the values and their symmetry. These are (Fig. 10.2). By definition, the mean of a normal
parameters if they describe a population and distribution is its mid-point and the areas
statistics if they refer to samples. under the curve on either side of this value
In any study the investigator wishes to know are equal. Another characteristic of this distri-
the parameters of the population (i.e. the “true” bution, or curve, is the spread or dispersion of
values) but these cannot be established unless values about the mean which is measured by
the population is taken as the sample. This is the variance, or the square root of the variance
2
normally not possible as the population is usu- called the standard deviation. Variance (σ )
ally several hundred thousands or millions of is the average squared deviation of all possible
tonnes of mineralized rock. A best estimate of values from the population mean:
these parameters can be made from sampling
−
the population and from the statistics of these 2 = ∑ ( ) X 2
x
i
samples. Indeed a population can be regarded as σ n
a collection of potential samples, probably sev-
2
eral million or more, waiting to be collected. where σ = population variance, x i = any sample
It is fundamental in sampling that samples value, X = population mean, n = number of
are representative, at all times, of the popula- samples.
tion. If they are not the results are incorrect.
The failure of some mineral ventures, and
losses recorded in the trading of mineral com-
modities, can be traced to unacceptable sam-
pling procedures due to confusion between
taking samples that are representive of the de-
posit being evaluated, and specimens whose Frequency
degree of representation is not known. 68%
95%
Homogeneity and heterogeneity 99%
Homogeneity is the property that defines a −3 −2 −1 X +1 +2 +3
population whose constituent units are strictly Low Variable High
identical with one another. Heterogeneity is FIG. 10.2 The normal distribution: the variable has a
the reverse condition. Sampling of the former continuous and symmetrical distribution about the
material can be completed by taking any group mean. The curve shows areas limited and occupied
of these units such as the most accessible frac- by successive standard deviations.