
Page 227 - Introduction to Mineral Exploration
P. 227
210 M.K.G. WHATELEY & B. SCOTT
(a) (b)
A 10,000 B A
8
10
5000
10 7 SAFE AREA 2000 D
C
C 1000
10 6 B
500 F
E
10 5 E 200
D H
Mass (g) 10 4 Mass (g) 100 G
50
G
F SAFETY LINE
10 3 20
SAFETY LINE UNSAFE AREA 5
H 10
100
10 2
I
1
I
1 100 200 500 1 2 5 10 20 50 100
µm mm
100 200 500 1 2 5 1 2 5 10 20
µm mm cm Top particle size d
Top particle size d
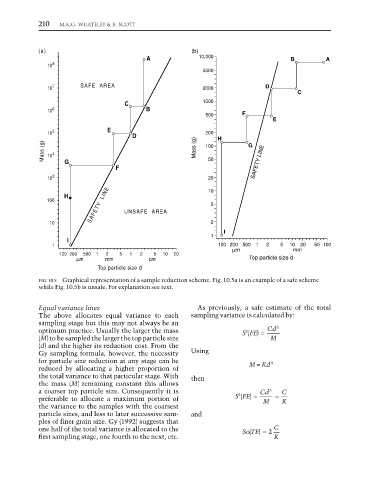
FIG. 10.5 Graphical representation of a sample reduction scheme. Fig. 10.5a is an example of a safe scheme
while Fig. 10.5b is unsafe. For explanation see text.
Equal variance lines As previously, a safe estimate of the total
The above allocates equal variance to each sampling variance is calculated by:
sampling stage but this may not always be an
optimum practice. Usually the larger the mass SFE) = Cd 3
2
(
(M) to be sampled the larger the top particle size M
(d) and the higher its reduction cost. From the
Gy sampling formula, however, the necessity Using
for particle size reduction at any stage can be 3
reduced by allocating a higher proportion of M = Kd
the total variance to that particular stage. With then
the mass (M) remaining constant this allows
a coarser top particle size. Consequently it is 2 Cd 3 C
(
preferable to allocate a maximum portion of SFE) = M = K
the variance to the samples with the coarsest
particle sizes, and less to later successive sam- and
ples of finer grain size. Gy (1992) suggests that
one half of the total variance is allocated to the SoTE) = 2 C
(
first sampling stage, one fourth to the next, etc. K