
Page 251 - Introduction to Mineral Exploration
P. 251
234 M.K.G. WHATELEY & B. SCOTT
(Geovariances 2001). Cumulative frequency includes the volume of the pore spaces. It is
distributions can also be plotted on normal obtained by laboratory measurement of field
probability paper and a straight line on such a samples.
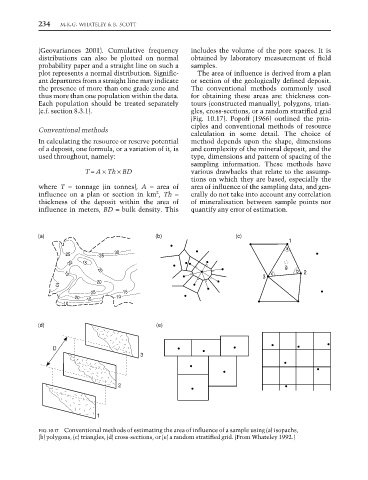
plot represents a normal distribution. Signific- The area of influence is derived from a plan
ant departures from a straight line may indicate or section of the geologically defined deposit.
the presence of more than one grade zone and The conventional methods commonly used
thus more than one population within the data. for obtaining these areas are: thickness con-
Each population should be treated separately tours (constructed manually), polygons, trian-
(c.f. section 8.3.1). gles, cross-sections, or a random stratified grid
(Fig. 10.17). Popoff (1966) outlined the prin-
ciples and conventional methods of resource
Conventional methods
calculation in some detail. The choice of
In calculating the resource or reserve potential method depends upon the shape, dimensions
of a deposit, one formula, or a variation of it, is and complexity of the mineral deposit, and the
used throughout, namely: type, dimensions and pattern of spacing of the
sampling information. These methods have
T = A × Th × BD various drawbacks that relate to the assump-
tions on which they are based, especially the
where T = tonnage (in tonnes), A = area of area of influence of the sampling data, and gen-
influence on a plan or section in km , Th = erally do not take into account any correlation
2
thickness of the deposit within the area of of mineralisation between sample points nor
influence in meters, BD = bulk density. This quantify any error of estimation.
(a) (b) (c)
1
a
25 25 30
20 15
g
b
20
c 2
15
3
20
10
25 15
20 15 10
10
(d) (e)
D
3
2
1
FIG. 10.17 Conventional methods of estimating the area of influence of a sample using (a) isopachs,
(b) polygons, (c) triangles, (d) cross-sections, or (e) a random stratified grid. (From Whateley 1992.)