
Page 254 - Introduction to Mineral Exploration
P. 254
10: EVALUATION TECHNIQUES 237
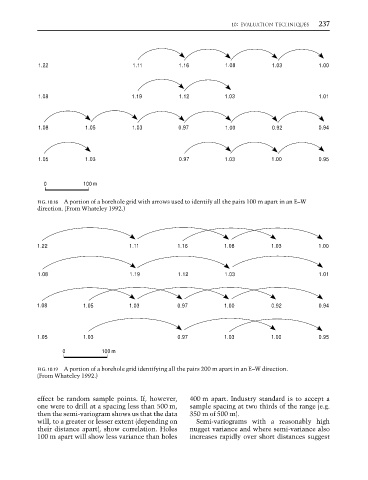
1.22 1.11 1.16 1.08 1.03 1.00
1.08 1.19 1.12 1.03 1.01
1.08 1.05 1.03 0.97 1.00 0.92 0.94
1.05 1.03 0.97 1.03 1.00 0.95
0 100 m
FIG. 10.18 A portion of a borehole grid with arrows used to identify all the pairs 100 m apart in an E–W
direction. (From Whateley 1992.)
1.22 1.11 1.16 1.08 1.03 1.00
1.08 1.19 1.12 1.03 1.01
1.08 1.05 1.03 0.97 1.00 0.92 0.94
1.05 1.03 0.97 1.03 1.00 0.95
0 100 m
FIG. 10.19 A portion of a borehole grid identifying all the pairs 200 m apart in an E–W direction.
(From Whateley 1992.)
effect be random sample points. If, however, 400 m apart. Industry standard is to accept a
one were to drill at a spacing less than 500 m, sample spacing at two thirds of the range (e.g.
then the semi-variogram shows us that the data 350 m of 500 m).
will, to a greater or lesser extent (depending on Semi-variograms with a reasonably high
their distance apart), show correlation. Holes nugget variance and where semi-variance also
100 m apart will show less variance than holes increases rapidly over short distances suggest