Page 255 - Introduction to Mineral Exploration
P. 255

238   M.K.G. WHATELEY & B. SCOTT


                  1.22                       1.11          1.16         1.08          1.03          1.00


                  1.08                       1.19          1.12         1.03                        1.01


                  1.08         1.05          1.03          0.97         1.00          0.92          0.94


                  1.05         1.03                        0.97         1.03          1.00          0.95
                                      0           100 m

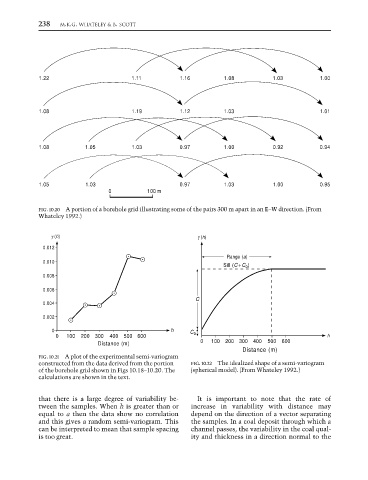
                  FIG. 10.20 A portion of a borehole grid illustrating some of the pairs 300 m apart in an E–W direction. (From
                  Whateley 1992.)


                     γ γ (h)                                    γ (h)
                                                                γ
                   0.012
                                                                         Range (a)
                   0.010
                                                                        Sill (C + C o )
                   0.008

                   0.006
                                                                C
                   0.004
                   0.002
                      0                                 h     C o
                       0  100  200  300  400  500 600                                                 h
                                   Distance (m)                  0  100  200 300  400  500  600
                                                                             Distance (m)
                  FIG. 10.21 A plot of the experimental semi-variogram
                  constructed from the data derived from the portion  FIG. 10.22 The idealized shape of a semi-variogram
                  of the borehole grid shown in Figs 10.18–10.20. The  (spherical model). (From Whateley 1992.)
                  calculations are shown in the text.

                  that there is a large degree of variability be-  It is important to note that the rate of
                  tween the samples. When h is greater than or  increase in variability with distance may
                  equal to a then the data show no correlation  depend on the direction of a vector separating
                  and this gives a random semi-variogram. This  the samples. In a coal deposit through which a
                  can be interpreted to mean that sample spacing  channel passes, the variability in the coal qual-
                  is too great.                               ity and thickness in a direction normal to the
   250   251   252   253   254   255   256   257   258   259   260