
Page 259 - Introduction to Mineral Exploration
P. 259
242 M.K.G. WHATELEY & B. SCOTT
drilling grid, block size would be 80 m. sulfur or trace element data points (Whateley
−3
Mineralized rock with a density of 2.6 t m in 2002). This creates estimation problems and
an 80 × 80 m block with a 15 m bench will difficulties in estimating life of mine (LOM)
provide 250 kt of material. This is usually too coal quality variability. This lack of data for
coarse to provide an estimate of local variab- some of the layers within a model presents
ility. This is a situation where conditional problems to the estimator for the application
simulation can be used because it allows the of the method. This is particularly true for
estimator to generate values on a very fine grid. sulfur values within some plies when less
All calculations are performed using gaussian than 30 samples of hard data are available
transformed (normalized) data (Deutsch 2002). for each layer. Adapting the conditional simu-
The properties of the resultant simulations lation technique, by using the more abund-
are such that they replicate the statistical and ant, but less reliable whole seam data (soft
geostatistical properties of the input data, as data) to augment the ply data, can mitigate
well as honoring the input data. The simulated this problem. Conditional simulation models
values are controlled, or conditioned, by drill- thus generated still need to be carefully
hole samples, which gives rise to the name examined and verified. Once they are found
of this technique (Deutsch & Journel 1998, to satisfactorily replicate the geological, stat-
Deutsch 2002). istical (Fig. 10.24), and geostatistical charac-
In coal deposits, some coal quality variables, teristics of raw data, the simulated quality
such as ash and calorific value, have large variability can be used for predicting LOM coal
numbers of data points. There are often fewer feed (Fig. 10.25).
20
18
Ply data
16
Conditional
simulation
14
Relative frequency (%) 12
10
8
6
4
2
0
0 0.4 0.8 1.2 1.6 2 2.4 2.8 3.2
Total sulfur (db %)
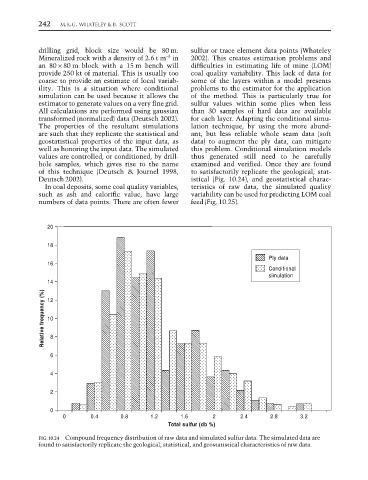
FIG. 10.24 Compound frequency distribution of raw data and simulated sulfur data. The simulated data are
found to satisfactorily replicate the geological, statistical, and geostatistical characteristics of raw data.