
Page 256 - Introduction to Mineral Exploration
P. 256
10: EVALUATION TECHNIQUES 239
γ γ (h) capable of producing a measurement of the
expected error of the estimate (see kriging vari-
ance below). The principles of kriging and types
Range (a) N–S
of kriging are discussed by Clark (1979), Journel
Range(a)E–W
and Huijbregts (1978), David (1988), Isaaks and
Srivastava (1989), Annels (1991), and Deutsch
(2002) amongst others. The kriging weights are
calculated such that they minimize estimation
variance by making extensive use of the semi-
variogram. The kriging estimator can be con-
sidered as unbiased under the constraint that
the sum of the weights is one. These weights
are then used to estimate the values of thick-
ness, elevation, grade, etc. for a series of blocks.
h Kriging gives more weight to closer samples
0 100 200 300 400 500 600
than more distant ones, it addresses clustering,
Distance (m) continuity and anisotropy are considered, the
geometry of the data points and the character
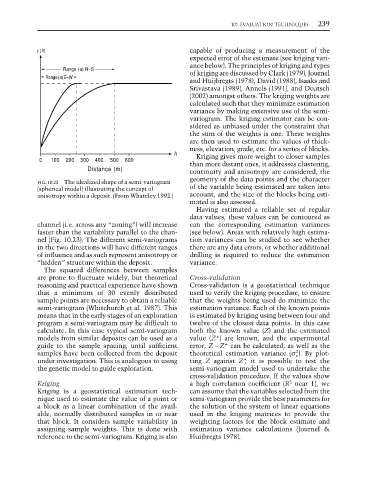
FIG. 10.23 The idealized shape of a semi-variogram
(spherical model) illustrating the concept of of the variable being estimated are taken into
anisotropy within a deposit. (From Whateley 1992.) account, and the size of the blocks being esti-
mated is also assessed.
Having estimated a reliable set of regular
data values, these values can be contoured as
channel (i.e. across any “zoning”) will increase can the corresponding estimation variances
faster than the variability parallel to the chan- (see below). Areas with relatively high estima-
nel (Fig. 10.23). The different semi-variograms tion variances can be studied to see whether
in the two directions will have different ranges there are any data errors, or whether additional
of influence and as such represent anisotropy or drilling is required to reduce the estimation
“hidden” structure within the deposit. variance.
The squared differences between samples
are prone to fluctuate widely, but theoretical Cross-validation
reasoning and practical experience have shown Cross-validation is a geostatistical technique
that a minimum of 30 evenly distributed used to verify the kriging procedure, to ensure
sample points are necessary to obtain a reliable that the weights being used do minimize the
semi-variogram (Whitchurch et al. 1987). This estimation variance. Each of the known points
means that in the early stages of an exploration is estimated by kriging using between four and
program a semi-variogram may be difficult to twelve of the closest data points. In this case
calculate. In this case typical semi-variogram both the known value (Z) and the estimated
models from similar deposits can be used as a value (Z*) are known, and the experimental
guide to the sample spacing, until sufficient error, Z–Z* can be calculated, as well as the
2
samples have been collected from the deposit theoretical estimation variance (σ e ). By plot-
under investigation. This is analogous to using ting Z against Z ,* it is possible to test the
the genetic model to guide exploration. semi-variogram model used to undertake the
cross-validation procedure. If the values show
2
Kriging a high correlation coefficient (R near 1), we
Kriging is a geostatistical estimation tech- can assume that the variables selected from the
nique used to estimate the value of a point or semi-variogram provide the best parameters for
a block as a linear combination of the avail- the solution of the system of linear equations
able, normally distributed samples in or near used in the kriging matrices to provide the
that block. It considers sample variability in weighting factors for the block estimate and
assigning sample weights. This is done with estimation variance calculations (Journel &
reference to the semi-variogram. Kriging is also Huijbregts 1978).