
Page 264 - Introduction to Mineral Exploration
P. 264
10: EVALUATION TECHNIQUES 247
τ
Yield point
Failure criterion
θ
σ Granite
Stress σ Marble
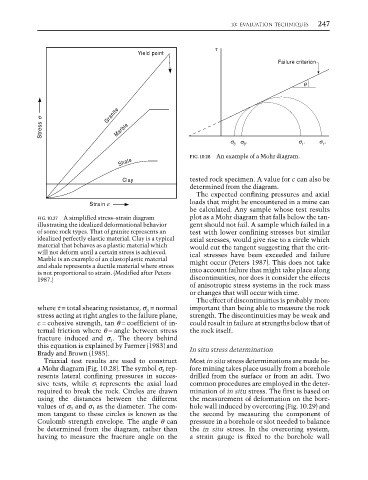
σ 3' σ 3'' σ 1' σ 1''
FIG. 10.28 An example of a Mohr diagram.
Shale
Clay tested rock specimen. A value for c can also be
determined from the diagram.
The expected confining pressures and axial
Strain ε ε loads that might be encountered in a mine can
be calculated. Any sample whose test results
FIG. 10.27 A simplified stress–strain diagram plot as a Mohr diagram that falls below the tan-
illustrating the idealized deformational behavior gent should not fail. A sample which failed in a
of some rock types. That of granite represents an test with lower confining stresses but similar
idealized perfectly elastic material. Clay is a typical axial stresses, would give rise to a circle which
material that behaves as a plastic material which would cut the tangent suggesting that the crit-
will not deform until a certain stress is achieved. ical stresses have been exceeded and failure
Marble is an example of an elastoplastic material might occur (Peters 1987). This does not take
and shale represents a ductile material where stress into account failure that might take place along
is not proportional to strain. (Modified after Peters
1987.) discontinuities, nor does it consider the effects
of anisotropic stress systems in the rock mass
or changes that will occur with time.
The effect of discontinuities is probably more
where τ = total shearing resistance, σ n = normal important than being able to measure the rock
stress acting at right angles to the failure plane, strength. The discontinuities may be weak and
c = cohesive strength, tan θ = coefficient of in- could result in failure at strengths below that of
ternal friction where θ = angle between stress the rock itself.
fracture induced and σ 1 . The theory behind
this equation is explained by Farmer (1983) and
Brady and Brown (1985). In situ stress determination
Triaxial test results are used to construct Most in situ stress determinations are made be-
a Mohr diagram (Fig. 10.28). The symbol σ 3 rep- fore mining takes place usually from a borehole
resents lateral confining pressures in succes- drilled from the surface or from an adit. Two
sive tests, while σ 1 represents the axial load common procedures are employed in the deter-
required to break the rock. Circles are drawn mination of in situ stress. The first is based on
using the distances between the different the measurement of deformation on the bore-
values of σ 3 and σ 1 as the diameter. The com- hole wall induced by overcoring (Fig. 10.29) and
mon tangent to these circles is known as the the second by measuring the component of
Coulomb strength envelope. The angle θ can pressure in a borehole or slot needed to balance
be determined from the diagram, rather than the in situ stress. In the overcoring system,
having to measure the fracture angle on the a strain gauge is fixed to the borehole wall