
Page 266 - Introduction to Mineral Exploration
P. 266
10: EVALUATION TECHNIQUES 249
Shaft
Dewatering borehole
Ore body
Ground surface
Piezometer installed
to measure the
water table level
Original water table
Drawdown
Piezometric surface
Cone of depression
Intersecting cones Flow line
of depression
Equipotential line Point of
discharge
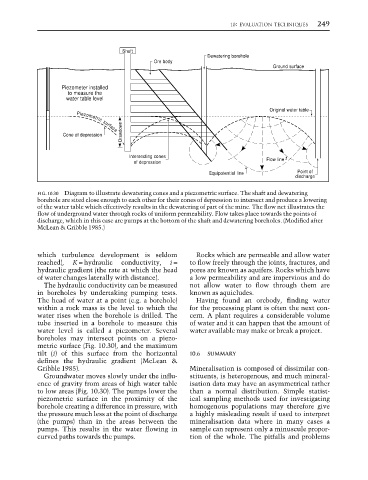
FIG. 10.30 Diagram to illustrate dewatering cones and a piezometric surface. The shaft and dewatering
borehole are sited close enough to each other for their cones of depression to intersect and produce a lowering
of the water table which effectively results in the dewatering of part of the mine. The flow net illustrates the
flow of underground water through rocks of uniform permeability. Flow takes place towards the points of
discharge, which in this case are pumps at the bottom of the shaft and dewatering boreholes. (Modified after
McLean & Gribble 1985.)
which turbulence development is seldom Rocks which are permeable and allow water
reached), K = hydraulic conductivity, i = to flow freely through the joints, fractures, and
hydraulic gradient (the rate at which the head pores are known as aquifers. Rocks which have
of water changes laterally with distance). a low permeability and are impervious and do
The hydraulic conductivity can be measured not allow water to flow through them are
in boreholes by undertaking pumping tests. known as aquicludes.
The head of water at a point (e.g. a borehole) Having found an orebody, finding water
within a rock mass is the level to which the for the processing plant is often the next con-
water rises when the borehole is drilled. The cern. A plant requires a considerable volume
tube inserted in a borehole to measure this of water and it can happen that the amount of
water level is called a piezometer. Several water available may make or break a project.
boreholes may intersect points on a piezo-
metric surface (Fig. 10.30), and the maximum
tilt (i) of this surface from the horizontal 10.6 SUMMARY
defines the hydraulic gradient (McLean &
Gribble 1985). Mineralisation is composed of dissimilar con-
Groundwater moves slowly under the influ- stituents, is heterogenous, and much mineral-
ence of gravity from areas of high water table isation data may have an asymmetrical rather
to low areas (Fig. 10.30). The pumps lower the than a normal distribution. Simple statist-
piezometric surface in the proximity of the ical sampling methods used for investigating
borehole creating a difference in pressure, with homogenous populations may therefore give
the pressure much less at the point of discharge a highly misleading result if used to interpret
(the pumps) than in the areas between the mineralisation data where in many cases a
pumps. This results in the water flowing in sample can represent only a minuscule propor-
curved paths towards the pumps. tion of the whole. The pitfalls and problems