
Page 303 - Introduction to Mineral Exploration
P. 303
286 M.K.G. WHATELEY & W.L. BARRETT
Figs 12.5 & 12.6
N
55
45
35
25
15
5
X X′
5
15
25
35
45
0 500 m
New Railway
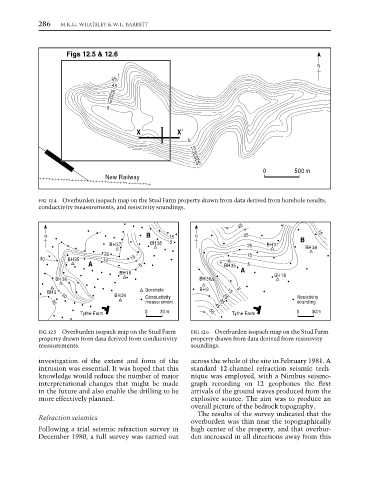
FIG. 12.4 Overburden isopach map on the Stud Farm property drawn from data derived from borehole results,
conductivity measurements, and resistivity soundings.
45
N B 15 N 35 B 15
BH37 BH38 5 25 BH37
BH38
20 15
30 BH35 10 15
A 5 BH35 5
A
BH18 BH18
BH36 BH36
Borehole BH3 5
BH3 15
BH34
30 Conductivity 25 Resistivity
measurement 45 35 sounding
35
0 30m 55 0 30m
Tythe Farm Tythe Farm
FIG. 12.5 Overburden isopach map on the Stud Farm FIG. 12.6 Overburden isopach map on the Stud Farm
property drawn from data derived from conductivity property drawn from data derived from resistivity
measurements. soundings.
investigation of the extent and form of the across the whole of the site in February 1981. A
intrusion was essential. It was hoped that this standard 12-channel refraction seismic tech-
knowledge would reduce the number of major nique was employed, with a Nimbus seismo-
interpretational changes that might be made graph recording on 12 geophones the first
in the future and also enable the drilling to be arrivals of the ground waves produced from the
more effectively planned. explosive source. The aim was to produce an
overall picture of the bedrock topography.
The results of the survey indicated that the
Refraction seismics
overburden was thin near the topographically
Following a trial seismic refraction survey in high center of the property, and that overbur-
December 1980, a full survey was carried out den increased in all directions away from this