
Page 305 - Introduction to Mineral Exploration
P. 305
288 M.K.G. WHATELEY & W.L. BARRETT
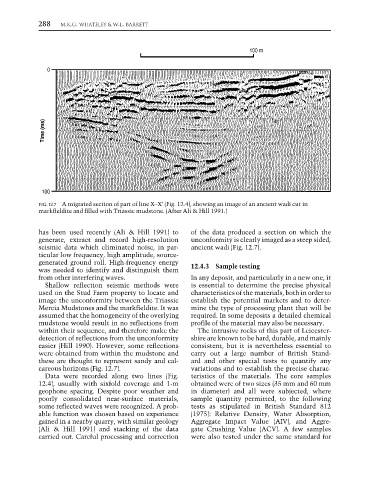
FIG. 12.7 A migrated section of part of line X–X′ (Fig. 12.4), showing an image of an ancient wadi cut in
markfieldite and filled with Triassic mudstone. (After Ali & Hill 1991.)
has been used recently (Ali & Hill 1991) to of the data produced a section on which the
generate, extract and record high-resolution unconformity is clearly imaged as a steep sided,
seismic data which eliminated noise, in par- ancient wadi (Fig. 12.7).
ticular low frequency, high amplitude, source-
generated ground roll. High-frequency energy
was needed to identify and distinguish them 12.4.3 Sample testing
from other interfering waves. In any deposit, and particularly in a new one, it
Shallow reflection seismic methods were is essential to determine the precise physical
used on the Stud Farm property to locate and characteristics of the materials, both in order to
image the unconformity between the Triassic establish the potential markets and to deter-
Mercia Mudstones and the markfieldite. It was mine the type of processing plant that will be
assumed that the homogeneity of the overlying required. In some deposits a detailed chemical
mudstone would result in no reflections from profile of the material may also be necessary.
within their sequence, and therefore make the The intrusive rocks of this part of Leicester-
detection of reflections from the unconformity shire are known to be hard, durable, and mainly
easier (Hill 1990). However, some reflections consistent, but it is nevertheless essential to
were obtained from within the mudstone and carry out a large number of British Stand-
these are thought to represent sandy and cal- ard and other special tests to quantify any
careous horizons (Fig. 12.7). variations and to establish the precise charac-
Data were recorded along two lines (Fig. teristics of the materials. The core samples
12.4), usually with sixfold coverage and 1-m obtained were of two sizes (35 mm and 60 mm
geophone spacing. Despite poor weather and in diameter) and all were subjected, where
poorly consolidated near-surface materials, sample quantity permitted, to the following
some reflected waves were recognized. A prob- tests as stipulated in British Standard 812
able function was chosen based on experience (1975): Relative Density, Water Absorption,
gained in a nearby quarry, with similar geology Aggregate Impact Value (AIV), and Aggre-
(Ali & Hill 1991) and stacking of the data gate Crushing Value (ACV). A few samples
carried out. Careful processing and correction were also tested under the same standard for