
Page 290 - Introduction to Petroleum Engineering
P. 290
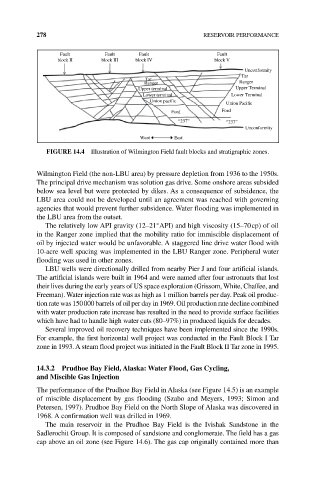
278 RESERVOIR PERFORMANCE
Fault Fault Fault Fault
block II block III block IV block V
Unconformity
Tar
Tar
Ranger Ranger
Upper terminal Upper Terminal
Lower terminal Lower Terminal
Union pacific Union Pacic
Ford Ford
“237” “237”
Unconformity
West East
FIgURE 14.4 Illustration of Wilmington Field fault blocks and stratigraphic zones.
Wilmington Field (the non‐LBU area) by pressure depletion from 1936 to the 1950s.
The principal drive mechanism was solution gas drive. Some onshore areas subsided
below sea level but were protected by dikes. As a consequence of subsidence, the
LBU area could not be developed until an agreement was reached with governing
agencies that would prevent further subsidence. Water flooding was implemented in
the LBU area from the outset.
The relatively low API gravity (12–21°API) and high viscosity (15–70 cp) of oil
in the Ranger zone implied that the mobility ratio for immiscible displacement of
oil by injected water would be unfavorable. A staggered line drive water flood with
10‐acre well spacing was implemented in the LBU Ranger zone. Peripheral water
flooding was used in other zones.
LBU wells were directionally drilled from nearby Pier J and four artificial islands.
The artificial islands were built in 1964 and were named after four astronauts that lost
their lives during the early years of US space exploration (Grissom, White, Chaffee, and
Freeman). Water injection rate was as high as 1 million barrels per day. Peak oil produc‑
tion rate was 150 000 barrels of oil per day in 1969. Oil production rate decline combined
with water production rate increase has resulted in the need to provide surface facilities
which have had to handle high water cuts (80–97%) in produced liquids for decades.
Several improved oil recovery techniques have been implemented since the 1990s.
For example, the first horizontal well project was conducted in the Fault Block I Tar
zone in 1993. A steam flood project was initiated in the Fault Block II Tar zone in 1995.
14.3.2 Prudhoe Bay Field, Alaska: Water Flood, gas Cycling,
and Miscible gas Injection
The performance of the Prudhoe Bay Field in Alaska (see Figure 14.5) is an example
of miscible displacement by gas flooding (Szabo and Meyers, 1993; Simon and
Petersen, 1997). Prudhoe Bay Field on the North Slope of Alaska was discovered in
1968. A confirmation well was drilled in 1969.
The main reservoir in the Prudhoe Bay Field is the Ivishak Sandstone in the
Sadlerochit Group. It is composed of sandstone and conglomerate. The field has a gas
cap above an oil zone (see Figure 14.6). The gas cap originally contained more than