
Page 53 - Introduction to Petroleum Engineering
P. 53
PEAK OIL 37
120
100
World production (MMB/d) 60
80
40
20
0
1940 1960 1980 2000 2020 2040 2060 2080 2100
Year
US EIA data Gaussian fit 2000 Gaussian fit 2008 Gaussian fit 2014
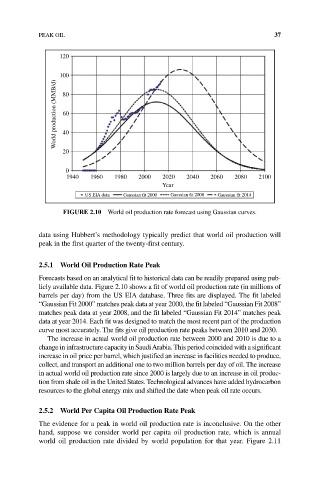
FIGURE 2.10 World oil production rate forecast using Gaussian curves.
data using Hubbert’s methodology typically predict that world oil production will
peak in the first quarter of the twenty‐first century.
2.5.1 World Oil Production Rate Peak
Forecasts based on an analytical fit to historical data can be readily prepared using pub-
licly available data. Figure 2.10 shows a fit of world oil production rate (in millions of
barrels per day) from the US EIA database. Three fits are displayed. The fit labeled
“Gaussian Fit 2000” matches peak data at year 2000, the fit labeled “Gaussian Fit 2008”
matches peak data at year 2008, and the fit labeled “Gaussian Fit 2014” matches peak
data at year 2014. Each fit was designed to match the most recent part of the production
curve most accurately. The fits give oil production rate peaks between 2010 and 2030.
The increase in actual world oil production rate between 2000 and 2010 is due to a
change in infrastructure capacity in Saudi Arabia. This period coincided with a significant
increase in oil price per barrel, which justified an increase in facilities needed to produce,
collect, and transport an additional one to two million barrels per day of oil. The increase
in actual world oil production rate since 2000 is largely due to an increase in oil produc-
tion from shale oil in the United States. Technological advances have added hydrocarbon
resources to the global energy mix and shifted the date when peak oil rate occurs.
2.5.2 World Per Capita Oil Production Rate Peak
The evidence for a peak in world oil production rate is inconclusive. On the other
hand, suppose we consider world per capita oil production rate, which is annual
world oil production rate divided by world population for that year. Figure 2.11