
Page 54 - Introduction to Petroleum Engineering
P. 54
38 THE FUTURE OF ENERGY
World oil
production rate per
capita (barrels/day) World population
per person (thousands)
1.60E–02 8000000
1.40E–02 7000000
1.20E–02 6000000
1.00E–02 5000000
8.00E–03 4000000
6.00E–03 3000000
Per capita rate World population
4.00E–03 2000000
2.00E–03 1000000
0.00E+00 0
1960 1970 1980 1990 2000 2010 2020
Year
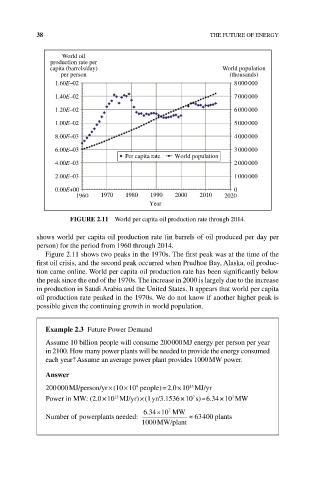
FIGURE 2.11 World per capita oil production rate through 2014.
shows world per capita oil production rate (in barrels of oil produced per day per
person) for the period from 1960 through 2014.
Figure 2.11 shows two peaks in the 1970s. The first peak was at the time of the
first oil crisis, and the second peak occurred when Prudhoe Bay, Alaska, oil produc-
tion came online. World per capita oil production rate has been significantly below
the peak since the end of the 1970s. The increase in 2000 is largely due to the increase
in production in Saudi Arabia and the United States. It appears that world per capita
oil production rate peaked in the 1970s. We do not know if another higher peak is
possible given the continuing growth in world population.
Example 2.3 Future Power Demand
Assume 10 billion people will consume 200 000 MJ energy per person per year
in 2100. How many power plants will be needed to provide the energy consumed
each year? Assume an average power plant provides 1000 MW power.
Answer
200 000 MJ/person/yr × (10 × 10 people) = 2.0 × 10 MJ/yr
9
15
Power in MW: (2.0 × 10 MJ/yr) × (1 yr/3.1536 × 10 s) ≈ 6.34 × 10 MW
15
7
7
×
63410 7 MW
.
Numberof powerplants needed: ≈ 63400 plannts
1000 MW/plant