Page 56 - Introduction to Petroleum Engineering
P. 56

40                                              THE FUTURE OF ENERGY

                     100
                      90
                                  Total
                      80          Coal
                      70          Natural gas
                                  Petroleum
                      60          Nuclear electric
                    Quads  50     Hydroelectric

                      40          Wood
                                  Other renewable
                      30
                      20
                      10
                       0
                       1650  1700  1750   1800  1850  1900   1950  2000
                                              Year
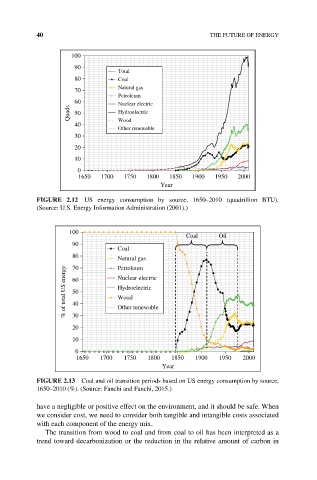
           FIGURE  2.12  US energy consumption by source, 1650–2010 (quadrillion BTU).
           (Source: U.S. Energy Information Administration (2001).)


                    100
                                                     Coal     Oil
                     90
                                  Coal
                     80       Total Natural gas
                              Coal  Petroleum
                     70
                   % of total US energy  60  Petroleum
                              Natural gas
                                  Nuclear electric
                                  Hydroelectric
                              Nuclear electric
                     50
                              Hydroelectric
                                  Wood
                     40
                              Wood
                                  Other renewable
                     30
                     20
                     10
                      0
                      1650   1700  1750   1800   1850  1900   1950  2000
                                              Year
           FIGURE 2.13  Coal and oil transition periods based on US energy consumption by source,
           1650–2010 (%). (Source: Fanchi and Fanchi, 2015.)

           have a negligible or positive effect on the environment, and it should be safe. When
           we consider cost, we need to consider both tangible and intangible costs associated
           with each component of the energy mix.
              The transition from wood to coal and from coal to oil has been interpreted as a
           trend toward decarbonization or the reduction in the relative amount of carbon in
   51   52   53   54   55   56   57   58   59   60   61