Page 283 - Laboratory Manual in Physical Geology
P. 283

A CTIVIT Y   9.3  Topographic Map Construction


                         Name: ______________________________________   Course/Section: ______________________   Date: ___________


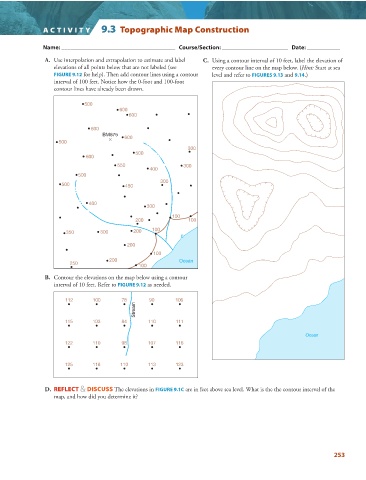
                         A.   Use interpolation and extrapolation to estimate and label     C.   Using a contour interval of 10 feet, label the elevation of


                          elevations of all points below that are not labeled (see   every contour line on the map below. ( Hint:  Start at sea


                            FIGURE   9.12  for help). Then add contour lines using a contour   level and refer to   FIGURES  9.13    and    9.14   .)

                          interval of 100 feet. Notice how the 0-foot and 100-foot
                          contour lines have already been drawn.
                                    500
                                                600
                                                   600
                                       600
                                          BM675
                                                  600
                            500
                            500
                                                                       300
                                                     500
                                     600
                                               550                   300
                                                          400
                                  500
                                                              300
                             500                  450

                                      400
                                                         300
                                                                  100
                                                     200               100
                              350         300        200   100
                                                                     0
                                                   200
                                                           100
                                             200                    Ocean
                               250
                                                       100


                         B.   Contour the elevations on the map below using a contour
                          interval of 10 feet. Refer to  FIGURE  9.12    as needed.

                              112      100       78       90       106
                                                     Stream

                              115      103       84       110      111

                                                                                                              Ocean
                              122      110       98       107      116


                              125      118      110       113      123


                         D.  REFLECT & DISCUSS The elevations in  FIGURE   9.1C    are in feet above sea level. What is the the contour interval of the
                          map, and how did you determine it?


                                                                                                                        253
   278   279   280   281   282   283   284   285   286   287   288